Qi-Hughes-Zhang model

Model for superconducting Quantum anomalous Hall insulator
Superconducting Qi-Wu-Zhang model
Xiao-Liang Qi, Taylor L. Hughes, and Shou-Cheng Zhang. Chiral topological superconductor from the quantum Hall state
Phys. Rev. B 82, 184516 – Published 10 November 2010 https://journals.aps.org/prb/abstract/10.1103/PhysRevB.82.184516
This UI interface enables continuous control of parameters in the Qi-Hughes-Zhang superconducting quantum anomalous Hall model. It allows for real-time interactive calculations and updates of various properties, including the Fermi surface, band dispersion, and Berry curvature for both upper and lower bands. Additionally, it calculates and displays the Chern numbers, slab geometry results, spectrum of topological edge states, wavefunctions of edge states, and the local density of states (LDOS).
Main panel: Click "Launch" button to initialize the UI demonstration and access the main panel displaying various quantities from the Qi-Hughes-Zhang model.
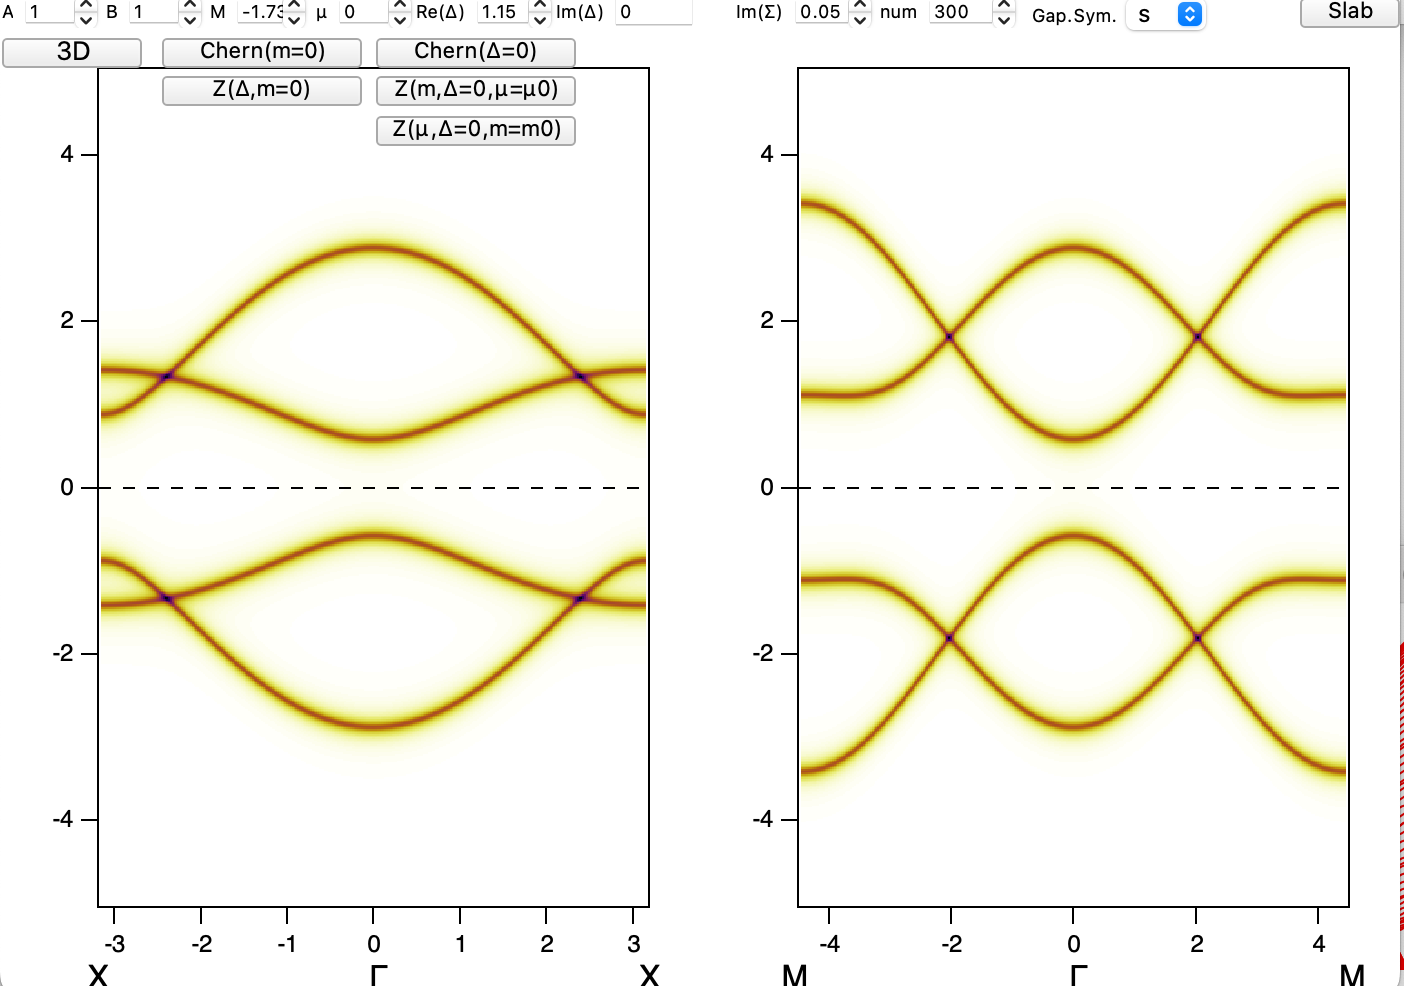
- In the main panel, the definition of the parameters "A" "B" "m" and "\mu" can be find in Qi-Wu-Zhang's paper, which control the electronic structure as well as topological invariant.
- The control variable "Im{Σ}" represents the imaginary part of the self-energy in the spectral function and contributes to the spectral weight displayed in the upper plots.
- In this model, the superconducting gap is introduced. Here I included both real and imaginary components of the superconducting order parameter. While the original Qi-Hughes-Zhang (QHZ) paper only considered plain s-wave pairing, different pairing symmetries can now be selected via the pop-up menu. Additionally, the "num" control variable adjusts the precision of the band structure simulation.
- Clicking "3D" will calculate the 3D spectral function of the QHZ bands and display it using the 3D smart displayer (refer to the manual from a recent project for more details). Additionally, to provide a better understanding of the normal-state band structure, the Fermi surface and band dispersion of the non-superconducting QWZ model will be plotted simultaneously. This allows for direct comparison between the normal and superconducting states, offering deeper insights into how the superconducting gap affects the electronic structure
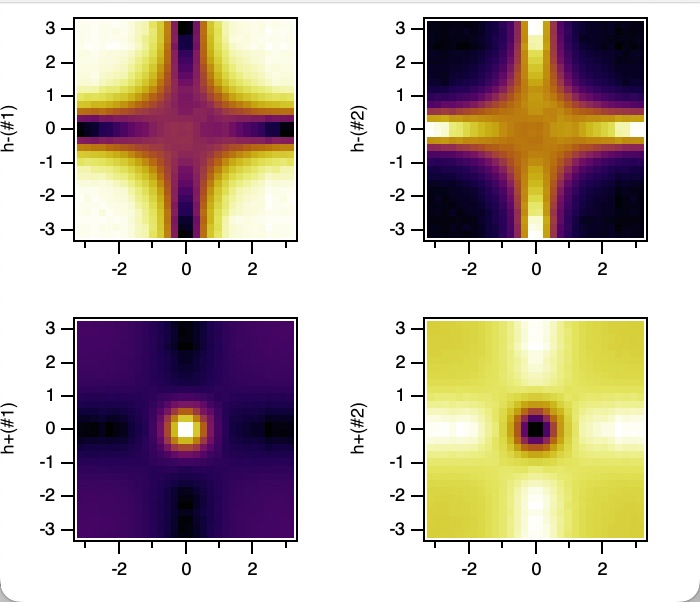
- Clicking the "Chern (m=0)" button will plot the Berry curvature map for all four branches of the bands. Additionally, the calculated Chern numbers for each band will be appended to the main panels, providing a clear visualization of topological properties across the different band branches. Here the Berry curvature was calculated by setting m = 0.
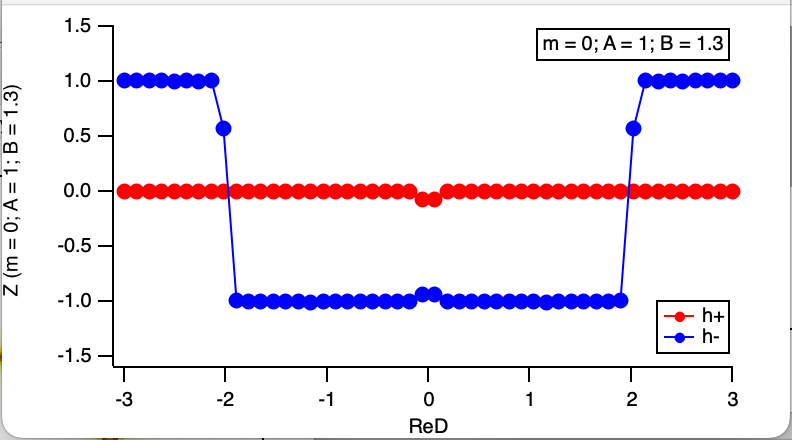
- The button labeled "Z(Δ, m=0)" calculates the Chern number as a function of the gap size when m=0. Additionally, there are three other buttons that calculate the Chern number along different directions in the parameter space: "Chern(Δ=0)", "Z(m, Δ=0, μ=μ_0)", and "Z(μ, Δ=0, m=m_0)".
- Note that in this main panel, the band structure represents the bulk electronic states. Next, we will introduce the function for measuring the edge states, which allows for direct observation of the topological properties.
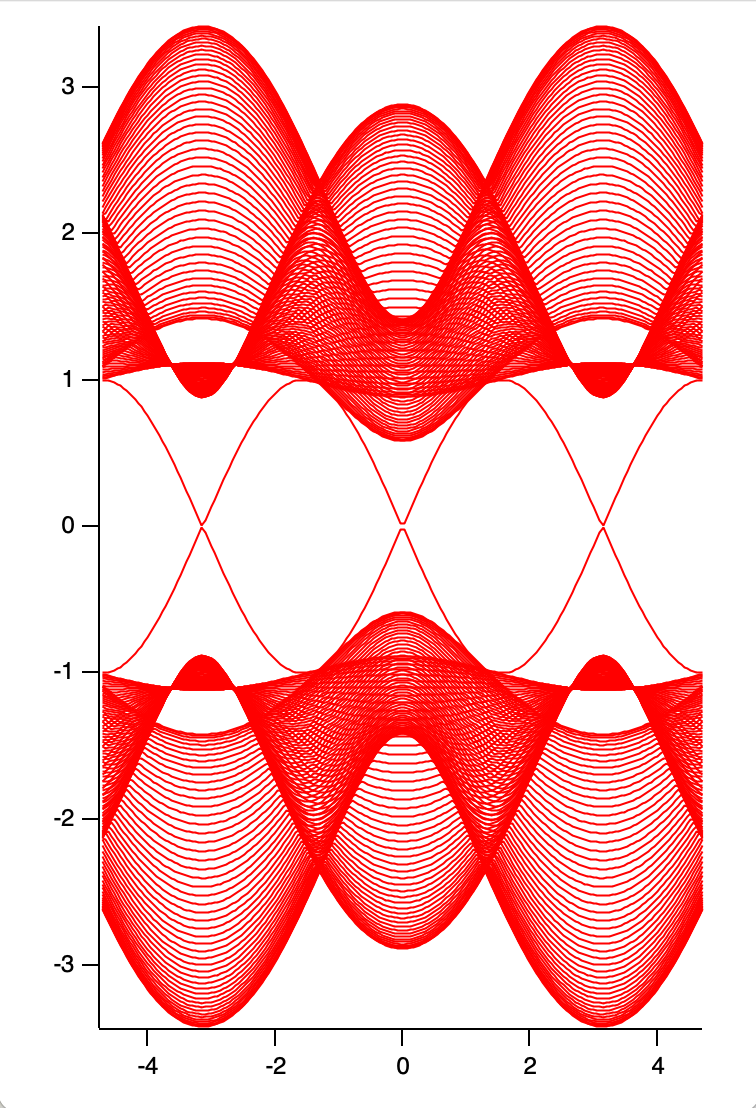
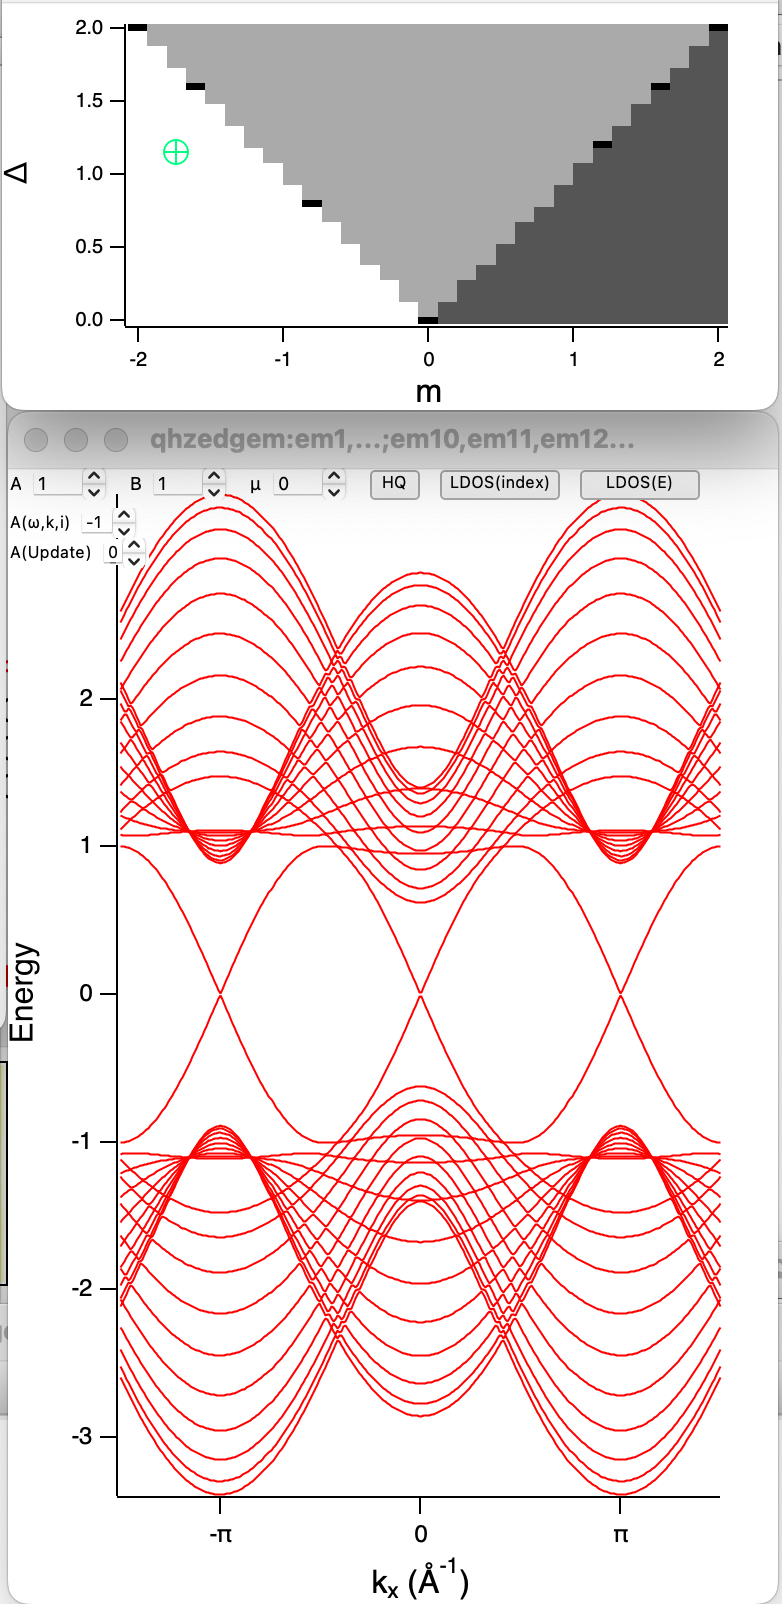
Slab panel: Click "Slab" button to access interaction display of the edge spectrum.
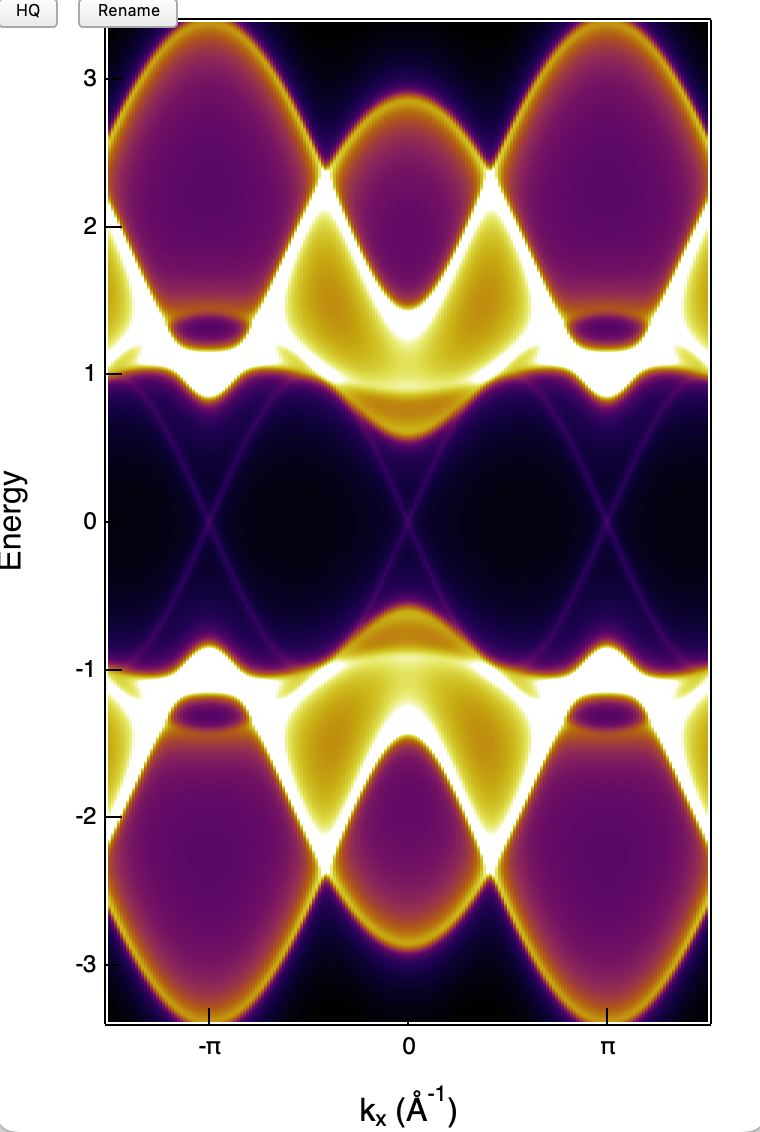
- The upper window displays a schematic phase diagram of the Chern number as a function of Δ and m (assuming μ=0). The green cursor is interactive; moving it with the mouse or the arrow keys on the keyboard will automatically adjust the parameters and recalculate everything. The lower window presents the slab calculation of the eigenvalues corresponding to each layer. If the phase sector is topologically nontrivial, you will observe topological edge states bridging the superconducting gap, indicating that the superconductor is a topological superconductor.
- Click "HQ" will recalculate the slab eigenvalues with more Slab number, and replot the curve figure.
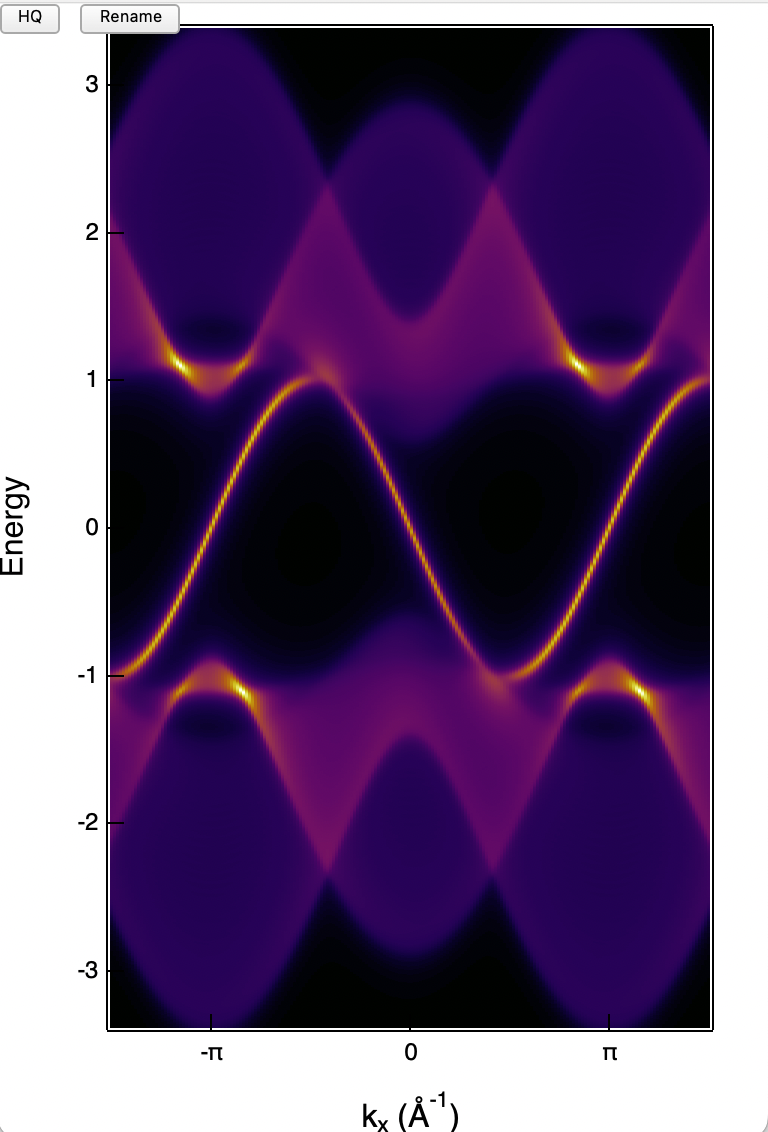
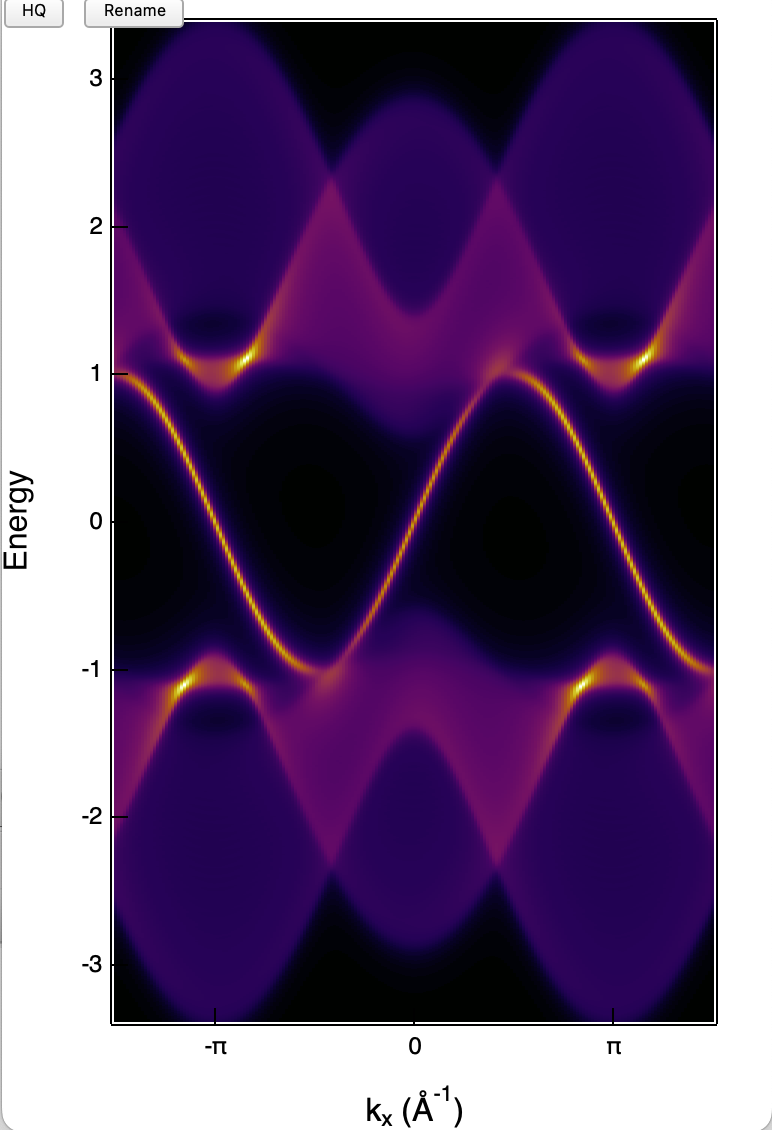
- Tuning the variable control "A(ω,k,i)" will calculate and show the Spectral function of the slab eigenvalues. Note that when A(ω,k,i) = 1, the spectral function will be calculated with equal weight for every slab; A(ω,k,i) = -1 the weight will exponential decays from the left edge, and A(ω,k,i) = 0 the weight will exponential decays from the right edge.
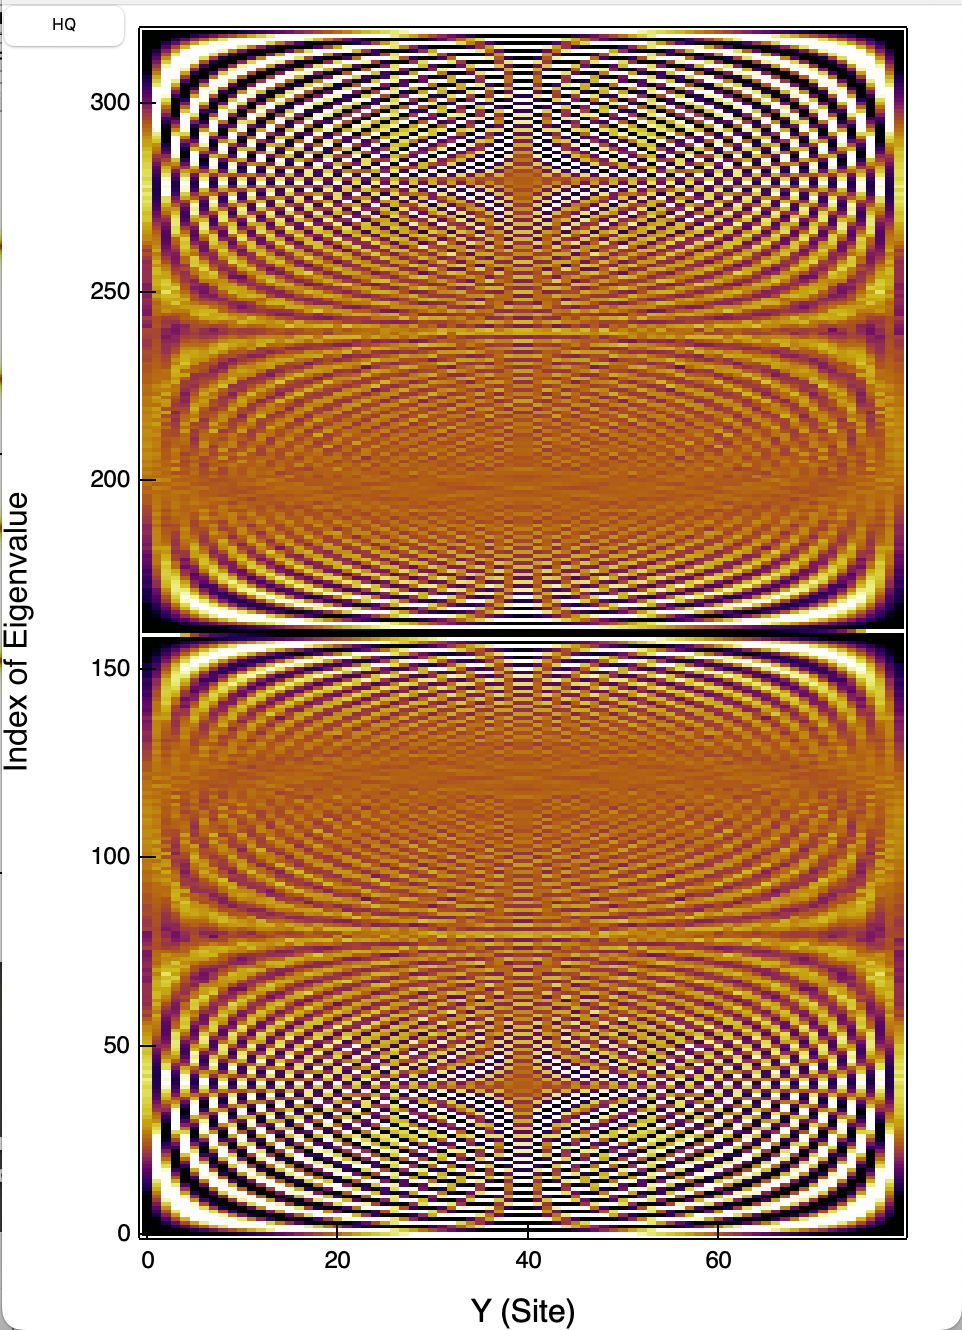
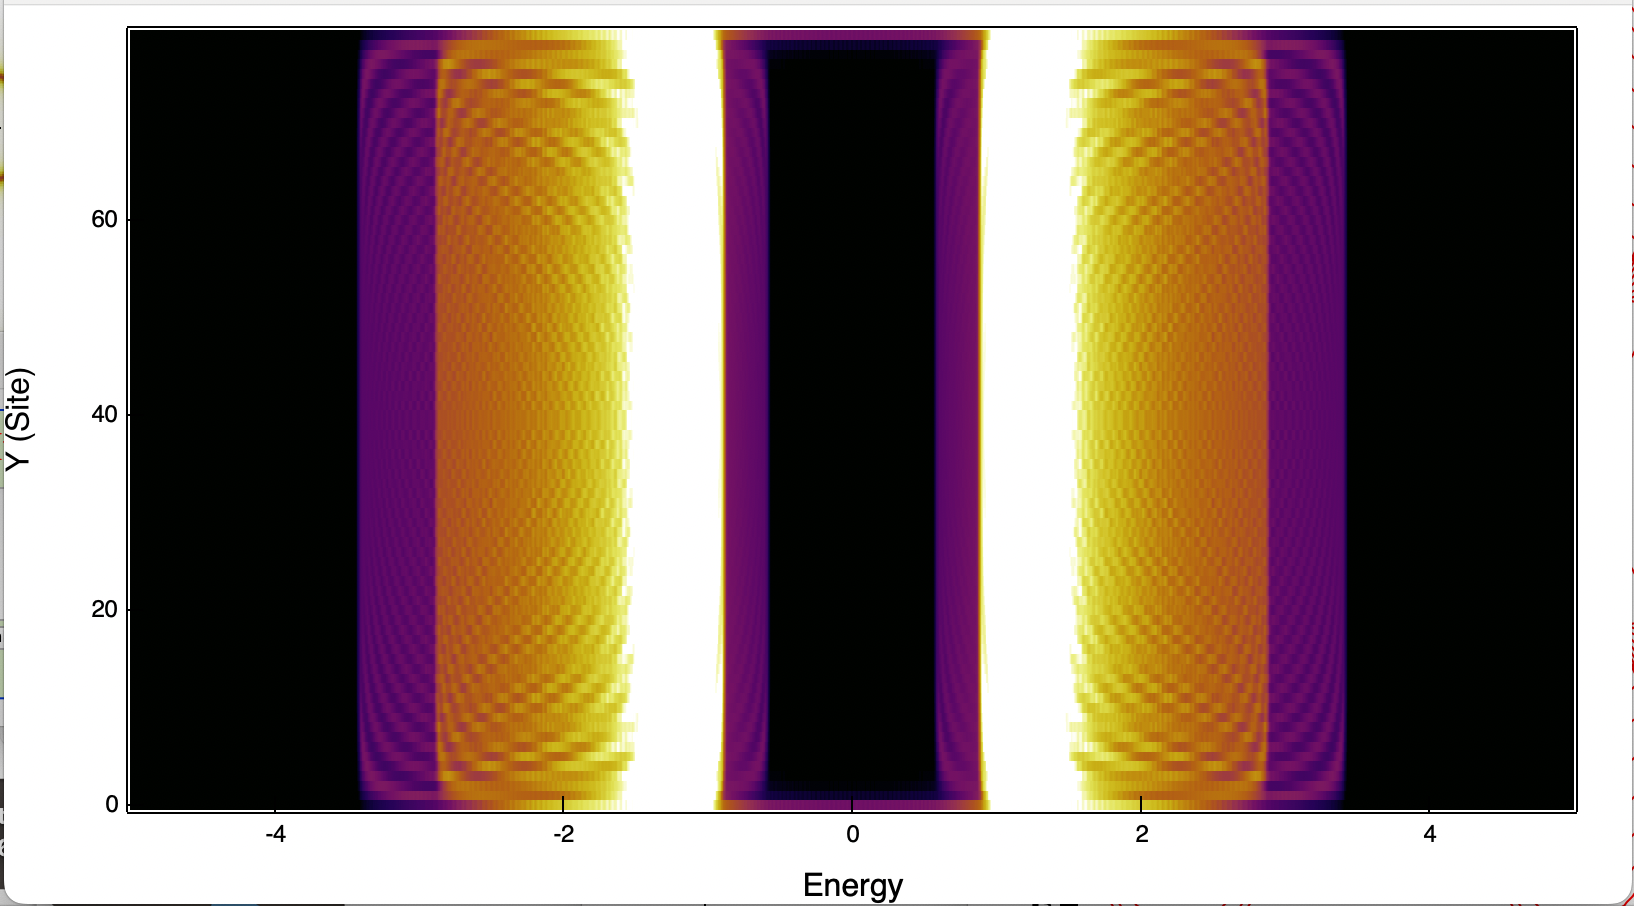
- Click "LDOS(index)" will show the slab layer resolved wave function of each eigenvalue.The Y-axis are eigenvalue index. Click "LDOS(index)" will show the slab layer resolved wave function of each eigenvalue.The Y-axis are converted to energy.
Images:
Project Details
Current Project Release
| Release File: | Qi-Hughes-Zhang Model.pxp (268.65 KB) |
| Version Date: | |
| OS Compatibility: | Mac-Intel |
| Release Notes: |
This function is part of the Kong Panel, an Igor Pro package developed by the author for processing STM data and performing simple model calculations. |

Forum

Support

Gallery
Igor Pro 10
Learn More
Igor XOP Toolkit
Learn More
Igor NIDAQ Tools MX
Learn More