Interactive 3D wave Displayer

This procedure provides a tool to interactively display a 3D wave by imaging the XY plane at any given value, as well as showing the XZ and YZ planes through an arbitrary line cut on the XY plane.
To begin, you need a wave with three layers, each clearly corresponding to the property you wish to display. For example, in this demonstration, I incorporated a 3D spectral function calculated using a simple Haldane model. In my examples, Layer #0, Layer #1, and Layer #2 correspond to k_x, k_y, and binding energy, respectively.
Now you can click launch button,
/sites/default/files/users/user25504/Screen%20Shot%202024-09-25%20at%203.54.52%20PM.png
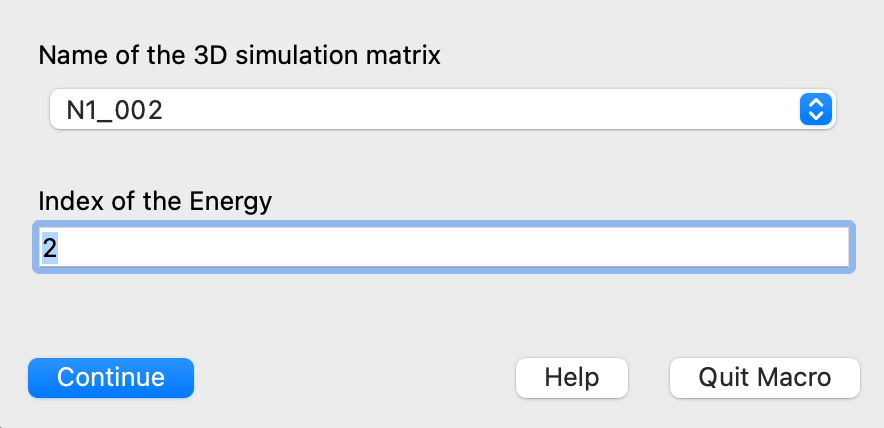
There will be a popup window
/sites/default/files/users/user25504/Screen%20Shot%202024-09-25%20at%203.55.46%20PM.png
You need to select the 3D wave from the list and enter the layer index corresponding to the binding energy. Note that the index can be any arbitrary number that exists for the wave; however, in that case, the main panel will display a different cut. Users are encouraged to experiment with their own data to explore this functionality.
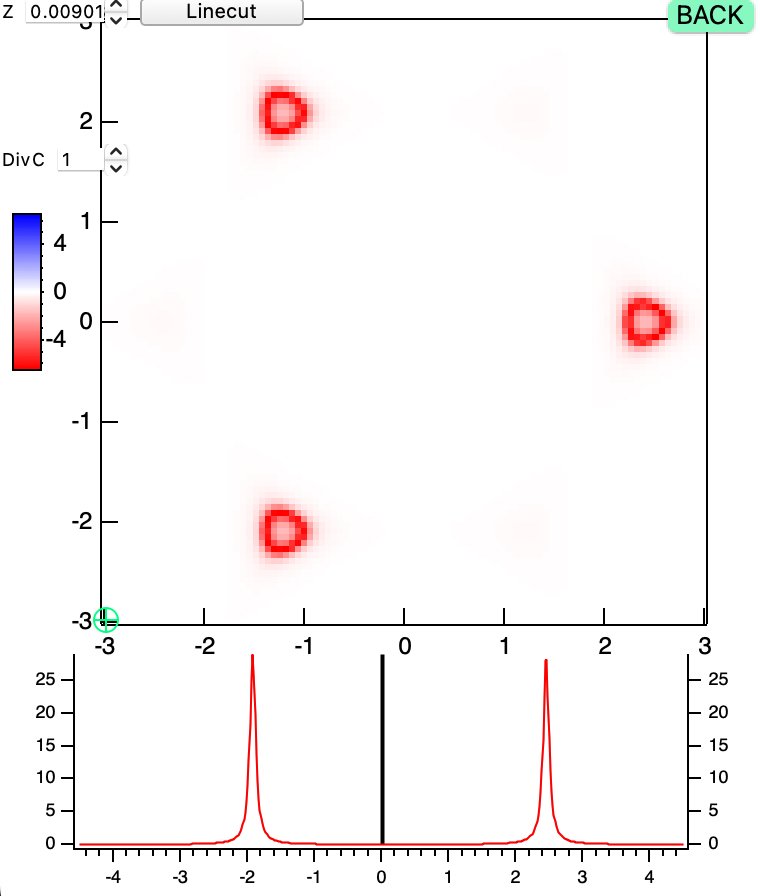
Click Enter, and the user interface (UI) will be displayed.
/sites/default/files/users/user25504/Screen%20Shot%202024-09-25%20at%203.56.42%20PM.png
The main panel is divided into two subwindows:
1. **Upper subwindow**: Displays a constant energy plot of the electronic states (e.g., Fermi surface when z = 0).
2. **Lower subwindow**: Shows both the averaged and single energy-dependent curves of the spectral weight as a function of energy. A black bar in the lower subwindow indicates the energy level being displayed in the upper subwindow.
**Interaction controls:**
1. The control variable **"Z"** adjusts the second layer value, representing the chemical potential in this example. As you control "Z," the black bar in the lower panel moves automatically.
2. In the upper panel, there is a green cursor that can be dragged using the mouse or moved with the arrow keys. As the cursor moves, the momentum-resolved single spectrum will update in real-time.
3. The control variable **"DivC"** adjusts the color mode. There are two built-in, fast-access options available.
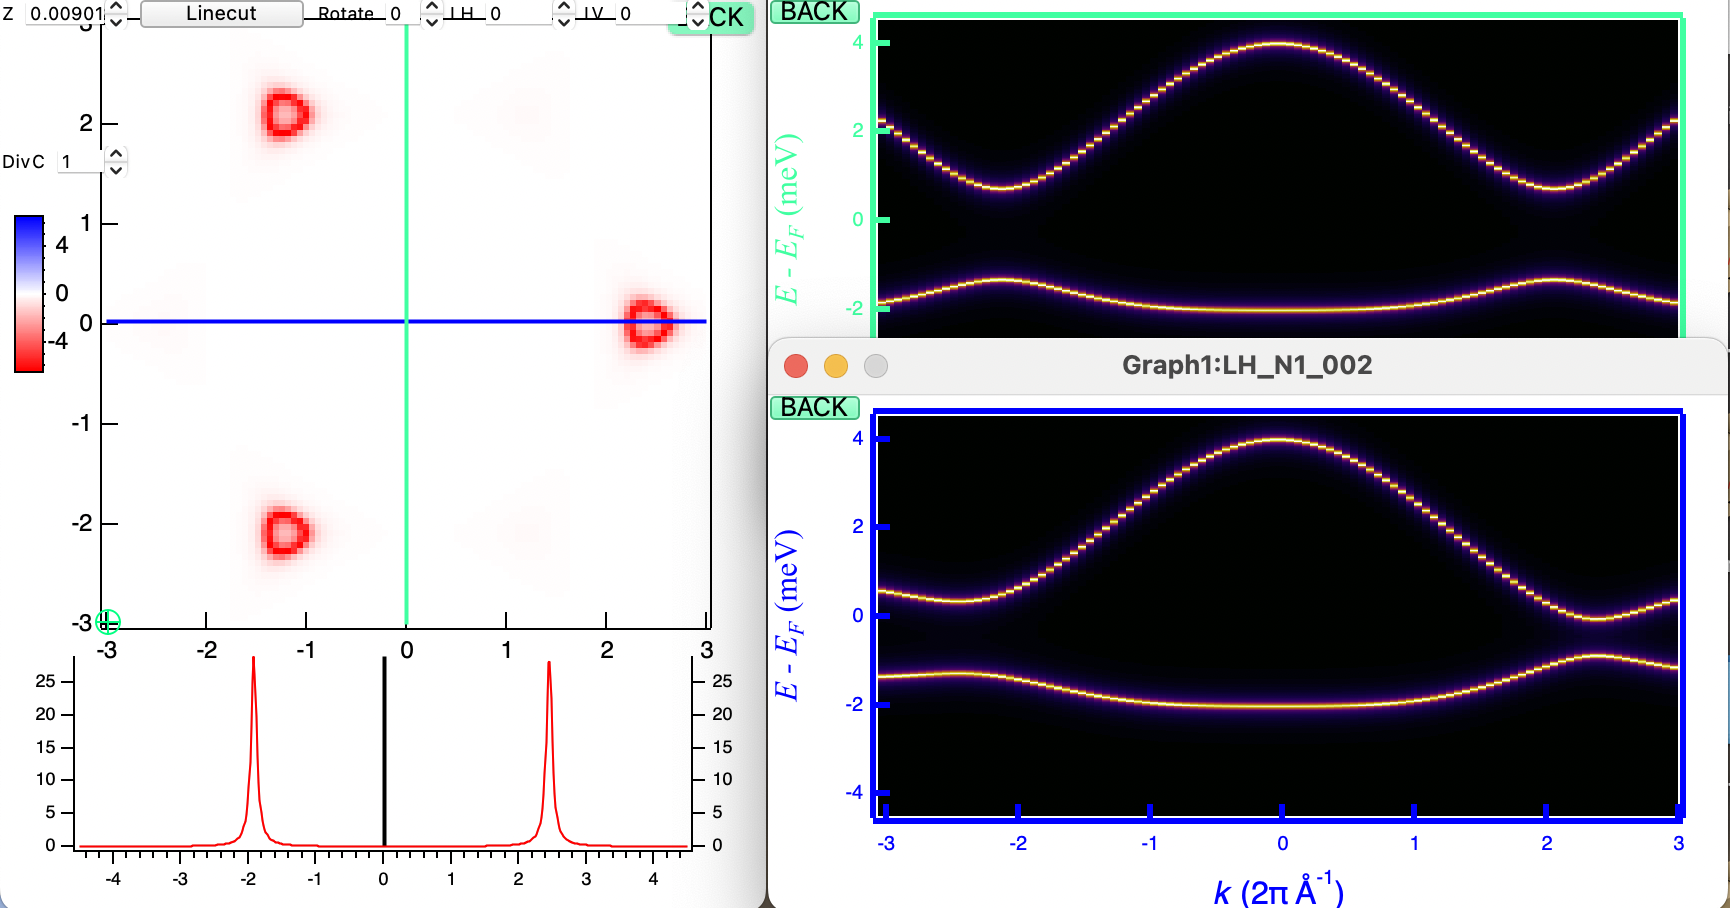
**Linecut Function**
Click the button "Linecut", the LH (linecut horizontal) and LV (Linecut Vertical) will display automatically. /sites/default/files/users/user25504/Screen%20Shot%202024-09-25%20at%204.00.29%20PM.png
Also, the control variable as well as the linecut indicators will be appended at the main panels.
You can extract any linecut along any direction from the 3D wave.
Images:
Project Details
Current Project Release
| Release File: | 3D band displayer_0.pxp (19.17 MB) |
| Version Date: | |
| OS Compatibility: | Mac-Intel |
| Release Notes: |
This function is a simplified version of the '3D Smart Displayer', a component of the Kong Panel, an Igor Pro package developed by the author for STM data processing and simple model calculations. |

Forum

Support

Gallery
Igor Pro 10
Learn More
Igor XOP Toolkit
Learn More
Igor NIDAQ Tools MX
Learn More