How to create a Source-Destination Circular Diagram?


thomas.pfeifer
Hello,
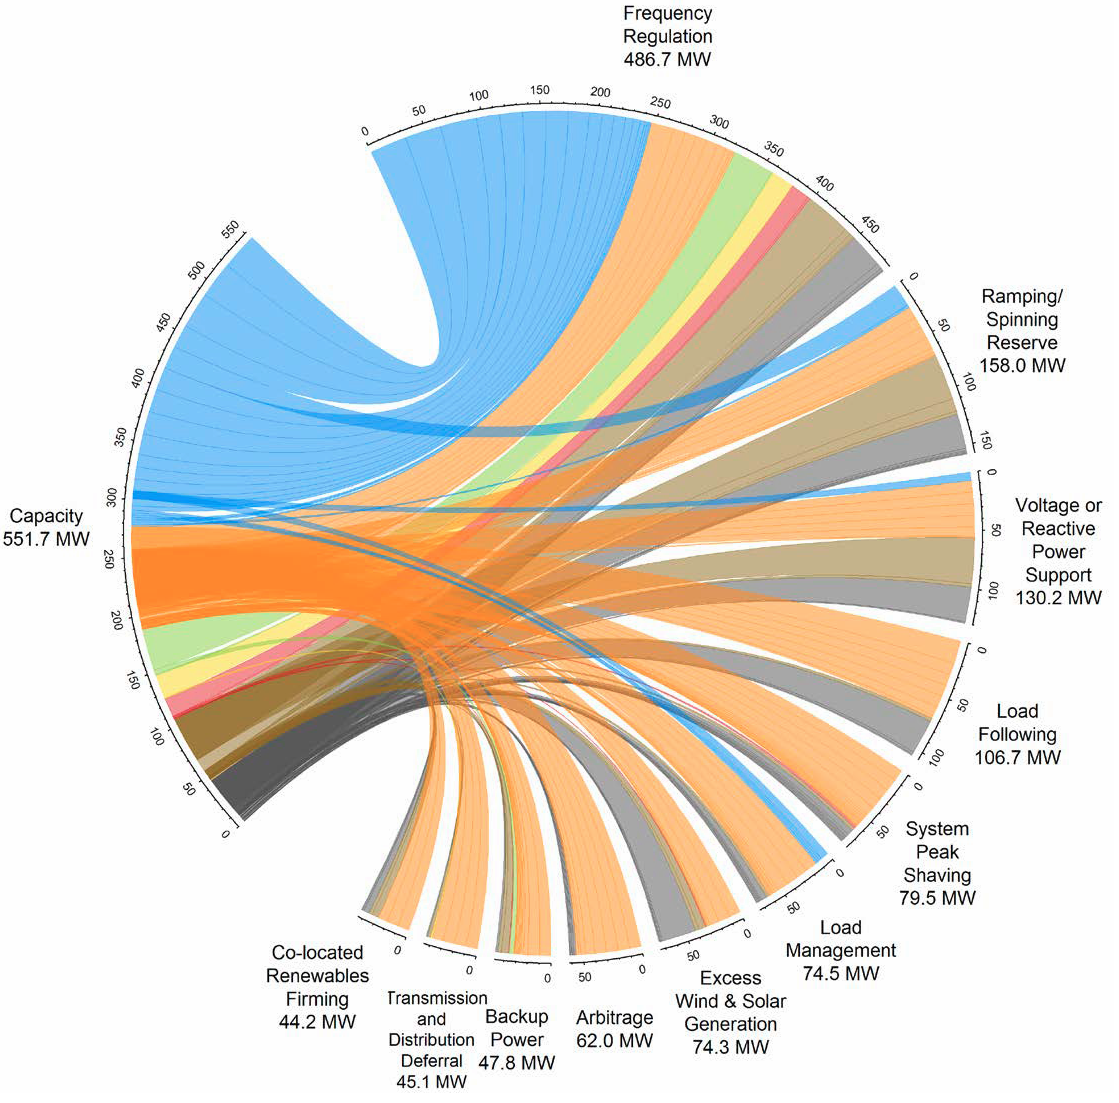
is there a way to create circular diagrams similar to the attached example in IGOR?
Apart from looking fancy, it seems to be a convenient way to visually compare different variants in a complex set of options. If I knew the correct naming of that diagram style, the topic description would have been more precise...
Any suggestions are welcome.
Regards,
Thomas

Forum

Support

Gallery
Igor Pro 9
Learn More
Igor XOP Toolkit
Learn More
Igor NIDAQ Tools MX
Learn More
I believe they are called circos plots and the linear version is a sankey diagram.
November 8, 2018 at 09:32 pm - Permalink