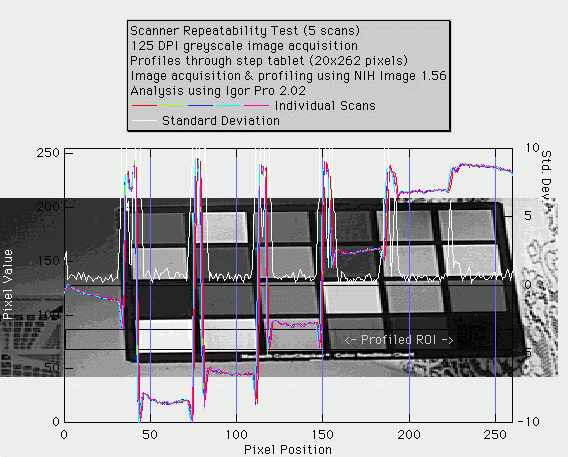

A scanned image of a photograph was acquired using NIH Image 1.56 in conjunction with a PhotoShop scanner plug-in. A portion of the image was profiled using NIH Image and the results pasted into a table in Igor Pro. The process was repeated four more times to assess the scanner reproducibility. The waves representing the profiles and their standard deviation were graphed in Igor Pro. The image comprising the source of the data, with the profiled area shown by the rectangle, was added as a background to the graph. The size of the image was tweaked using the expansion arguments of the DrawPICT command in order to match the length of the profiled region-of-interest (ROI) to the length of the bottom axis.
Submitted by Michael Young.

Forum

Support

Gallery
Igor Pro 9
Learn More
Igor XOP Toolkit
Learn More
Igor NIDAQ Tools MX
Learn More


