


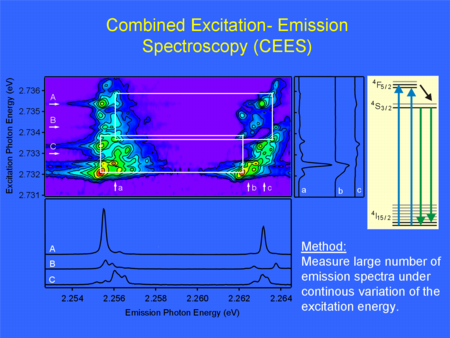
Visualization of different erbium defects with combined excitation-emission spectroscopy. In this spectroscopic method we take advantage of a CCD-detector attached to a monochromator and record a large number of emission spectra for a dense sequence of excitation energies. The resulting 2D data is best visualized in a contour plot. This way emission of different defects can be distinguished and show up as a "peak" in the contour plot. As an excitation source a tunable blue dye laser was used. The excitation-emission scheme is shown on the right side.
Lithium niobate is an attractive host material for applications in optical telecommunication.
Submitted by Christian Sandmann

Forum

Support

Gallery
Igor Pro 10
Learn More
Igor XOP Toolkit
Learn More
Igor NIDAQ Tools MX
Learn More