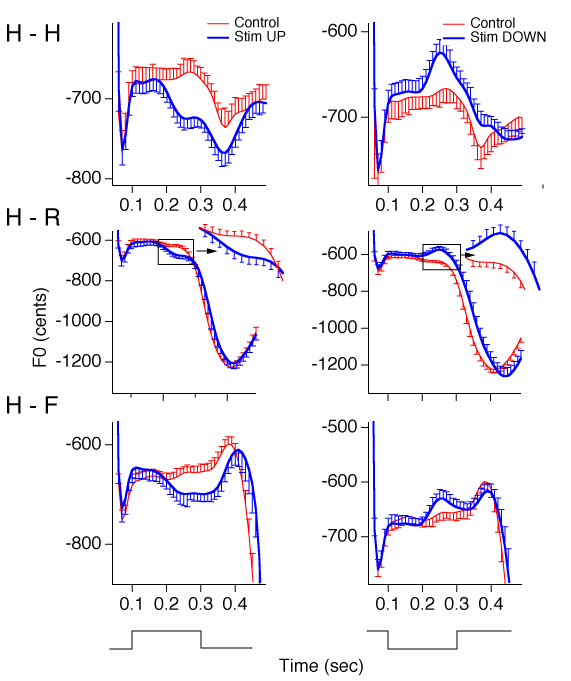

Control and test average waves during H-H, H-R, and H-F sequences at the 100 ms stimulus timing condition. Heavy dashed lines are simulations produced by the model. The vertical arrow indicates time where the response magnitude was measured for this trace. Error bars represent the standard error of the mean for a single direction. The inset shows an expanded portion of average waves. Curves at the bottom indicate the time and direction of the stimulus. For all panels, the stimulus onset occurred approximately at 0.1 s. The x-axis (time) starts at 0.05 s, which is 0.05 s after vocalization onset. Note that the y-axis differs for each plot.
Submitted by Chuck Larson of Northwestern University.

Forum

Support

Gallery
Igor Pro 9
Learn More
Igor XOP Toolkit
Learn More
Igor NIDAQ Tools MX
Learn More


