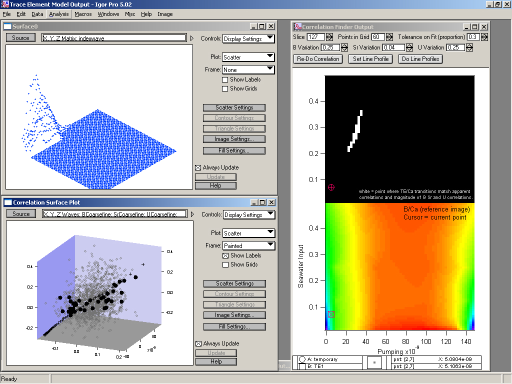

This user interface controls procedures which automate the search for regions of the model which match observations made in the coral. The user inputs several parameters representing the observations using 'setvariables' on the panel (right). The procedure then searches the model output for matching regions, and presents them in a surface plot (top left) and on interpolated images of the model output (right).
The user is then able to position cursors on the interpolated model output and make line profiles from the images to study the behaviour of the model. Three of the line profiles are automatically appended to a 3D scatter plot of the observational data (bottom left), allowing the user to study the fit between the model and the observed data in three dimensions.
See also other gallery examples from this experiment:
Line Profiles from a Numerical Model of Coral BiomineralizationLine Profiles from a Numerical Model of Coral Biomineralization
Output from a Numerical Model of Coral BiomineralizationOutput from a Numerical Model of Coral Biomineralization
Modelled B/Ca Ratios in the Skeleton of a CoralModelled B/Ca Ratios in the Skeleton of a Coral
Submitted by
Dan Sinclair

Forum

Support

Gallery
Igor Pro 9
Learn More
Igor XOP Toolkit
Learn More
Igor NIDAQ Tools MX
Learn More


