


Get to Know a Feature: Color Table Wave Creation
Created on October 4 at 12:02 pm - by: admin
In "Get to Know a Feature: Color Table Wave Basics", we showed how Igor Pro 7's color table waves are more flexible than Igor Pro 6's color index waves because multiple uses of the same color table wave can cover differing Z value ranges.
We previously showed that you can use Data→Packages→Color Wave Editor to create color table waves by modifying a copy of a built-in color table, or by directly choosing the color for each row of a color wave.
COLOR TABLE WAVE VALUES
Color table (and color index) waves have one row for each color, and 3 or 4 columns for red, green, blue and optionally alpha components containing values that range from 0-65535.
It is useful to realize that any color index wave can also be used as a color table wave; the difference is simply that Igor 7 ignores the X scaling when using a wave as a color table wave.
Here are some other ways to create color table waves:
IMPORTING RGB VALUES FROM A CSV FILE
Sometimes a researcher is kind enough to provide a data file containing the red, green, blue values in a data file, which we can import and rescale to Igor's color range.
For example, from Color Schemes Appropriate for Scientific Data Graphics, you can download a "color number text file", such as this Blue-to-Green 14-step table:

You could just copy the values from the text file and paste them into an Igor table, but for larger color tables that would be too painful, and what are computers for, anyway?
Let's load the file (from the Clipboard in my case) as delimited text into a "color0" matrix wave:
•LoadWave/J/M/D/A=color/K=1/V={"\t, "," $",0,1}/L={0,2,0,0,0} "Clipboard"
  Delimited text load from "Clipboard"
  Matrix size: (14,14), wave: color0
•Edit color0

The last three columns are the Red, Green, and Blue components.
An easy way to make a color wave is to Duplicate columns 11, 12, and 13 into a new wave, which we will name "BlueGreen", using Igor 7's handy new /RMD flag for the Duplicate operation:
•Duplicate/O/RMD=[][11,13] color0, BlueGreen // copy all rows, cols 11-13

Igor uses a range of 0-65535 for colors, instead of the 0-255 used here.
It is not obvious, but multiplying by 257 (not the 256 you might expect) scales to Igor's 0-65535 rather nicely:
•Print 65535 / 256
  255.996
•Print 65535 / 257
  255
Let's convert the wave's numeric type to unsigned 16-bit integer and then multiply by 257.
•Redimension/W/U BlueGreen
•BlueGreen *= 257
It wouldn't hurt to reset the Y scaling to match the column number, and even set dimension labels just for clarity:
•SetScale/P y, 0, 1, "", BlueGreen
•SetDimLabel 1, 0, red, BlueGreen
•SetDimLabel 1, 1, green, BlueGreen
•SetDimLabel 1, 2, blue, BlueGreen

This is what this color table wave looks like in an image plot and ColorScale:
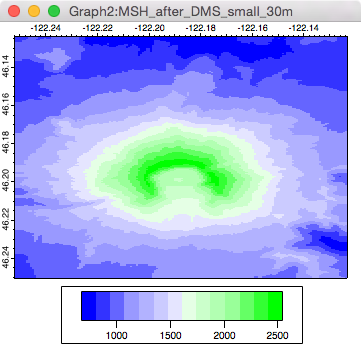
Which compares nicely to the original:
RECREATING A COLOR TABLE FROM A SCREEN CAPTURE
A captured screen shot can be used to reproduce a color table when the numeric values aren't available.
Here's an example of reproducing the many-valued "Ametrine" color table from École Polytechnique Fédérale de Lausanne:

Screen capture of the Ametrine color table
Loading this screen capture as an Igor RGB Image plot is straightfoward; use a screen capture utility to save a .TIFF or .PNG file, and load it as an image.
STEP 1: SAVE A SCREEN CAPTURE TO A FILE
On Macintosh, the built-in screen capture to a file is done by pressing Cmd+Shift+4, using the mouse to drag out a marquee around the to-be-captured element.
Upon release of the mouse button, a .tiff file is saved to the desktop (some versions of Mac OS X save a .png file).
STEP 2: LOAD THE FILE AS AN IMAGE PLOT
Use Igor 7's Data->Load Image dialog and load the TIFF or PNG screen shot file as an RGB image:

STEP 3: EXTRACT THE COLOR TABLE WAVE FROM THE IMAGE PLOT
We want only a portion of the image plot's values for our color table. We can use the marquee to indicate where the colors are, and then create a GraphMarquee menu definition and associated code to extract the colors from that region:

(GraphMarquee code for extracting the color table values, ready to be copied and pasted into an Igor procedure file, follows at the end of this article.)
The resulting color table wave is displayed in an image plot so that you can check that no unintended pixels crept into the color table wave. Adjusting the marquee and selecting Color Table from Selection again updates the same color table wave and image plot.

COMPARING THE EXTRACTED THE COLOR TABLE WAVE WITH IDEAL VALUES
We can check the results by downloading the corresponding csv file:
•LoadWave/J/M/A=ametrine/P=text/K=0 "ametrine.txt"
  Delimited text load from "ametrine.txt"
  Matrix size: (256,3), wave: ametrine0
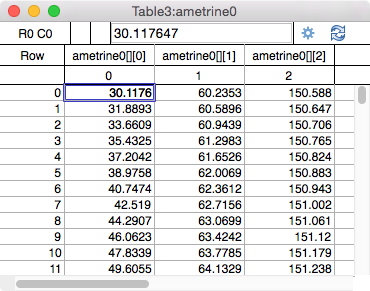
Then we can scale the ametrine0 values from 0-255 to 0-65535 and apply the resulting color table wave to a copy of the image plot with the extracted color table wave for comparison:
•ametrine0 *= 257
•Redimension/U/W ametrine0
•ModifyImage/W=CTabDemoColorTable_1 ColorTableImg ctab= {*,*,ametrine0,0}
Pretty tough to tell the difference:

REUSING THE EXTRACTED THE COLOR TABLE WAVE
A good way to make the color table wave available to multiple experiments is to save the color table wave as an Igor Binary wave in an easily-accessed folder.
Simply load the binary wave and choose it in the Modify Image Appearance dialog.
Whether you copy the binary wave into your experiment file or leave it "shared" (saved separate from the experiment on disk) is up to you.
Igor 7.01 or later will ship with many color table waves in a Color Table Waves folder for convenience. They have been created using the sources listed below.
REFERENCES
- Color Map Advice for Scientific Visualization
- Colormaps - Data Science at Scale
- How to display data by color schemes compatible with red-green color perception deficiencies, by Matthias Geissbuehler and Theo Lasser
- Color Schemes Appropriate for Scientific Data Graphics
- Matplotlib: show colormaps
COLOR TABLE FROM SELECTION CODE
#pragma TextEncoding = "UTF-8"
#pragma rtGlobals=3     // Use modern global access method and strict wave access.
#pragma version=7.01        // will ship with Igor 701
#pragma IgorVersion=7       // color table waves require Igor 7+

Menu "Image", dynamic
    WMColorTableFromMenu("Color Table from Graph..."), /Q, WMColorTableFromGraph()
End

Menu "GraphMarquee", dynamic
    WMColorTableFromMenu("Color Table from Selection..."), /Q, WMColorTableFromGraph()
End

Function/S WMColorTableFromMenu(String enabledItem)

    String item=""  // disappears
    String graphName= WinName(0,1)
    String images= ImageNameList(graphName, ";")
    if( ItemsInList(images) == 1 )  // works with graphs having only 1 image plot
        String imageName= StringFromList(0,images)
        WAVE/Z image= ImageNameToWaveRef(graphName, imageName)
        Variable layers= DimSize(image,2)
        if( layers >= 3 )   // must be RGB or RGBA image.
            item= enabledItem   // "Color Table from Selection", etc.
        endif
    endif
    return item
End

Proc WMColorTableFromGraph(outputName)
    String outputName=StrVarOrDefault("root:Packages:WMColorTableFromGraph:ctableName", "ColorTable")   // default, missing parameter dialog gives user chance to change it

    outputName= CleanupName(outputName,1)

    NewDataFolder/O root:Packages
    NewDataFolder/O root:Packages:WMColorTableFromGraph
    String/G root:Packages:WMColorTableFromGraph:ctableName = outputName

    Variable created = WMColorTableGraphOrMarquee(outputName)
    if( created )
        WMDemoColorTableWave($outputName)
    endif
End

// Samples the first image in the top graph along the image's or marquee's
// longest dimension, in the middle of the shortest dimension.
//
// Note that dimensions may not correlate with marquee lengths if h & v scales differ.
// Scakes will not differ if NewImage is used to initially display the image
// and if the graph is not resized afterwards.
//
// Best is to use ModifyGraph width={perUnit,1,top},height={perUnit,1,left} to avoid confusion.
Function WMColorTableGraphOrMarquee(String outputName)

    outputName= CleanupName(outputName,1)
    if( strlen(outputName) == 0 )
        DoAlert 0, "Expected outputName!"
        return 0
    endif

    String graphName= WinName(0,1)
    if( strlen(graphName) == 0 )
        DoAlert 0, "Expected graph!"
        return 0
    endif
    String images= ImageNameList(graphName, ";")
    if( strlen(images) == 0 )
        DoAlert 0, "Expected image in "+graphName+"!"
        return 0
    endif
    String imageName= StringFromList(0,images)
    WAVE image= ImageNameToWaveRef(graphName, imageName)
    Variable layers= DimSize(image,2)
    if( layers < 3 )
        DoAlert 0, "Expected "+imageName+" to be an RGB image!"
        return 0
    endif

    Variable firstRow, lastRow, firstCol, lastCol
    Variable haveMarquee= WMGetMarqueeImageBounds(graphName, imageName, firstRow, lastRow, firstCol, lastCol)

    Variable cRows= lastRow-firstRow+1
    Variable cCols= lastCol-firstCol+1
    if( layers > 4 )
        layers= 4
    endif
    Variable center
    if( cRows > cCols )
        center= floor((firstCol+lastCol)/2)
        Make/O/N=(cRows, layers) $outputName/WAVE=ctable
        ctable= image[p+firstRow][center][q]
    else
        center= floor((lastRow+firstRow)/2)
        Make/O/N=(cCols, layers) $outputName/WAVE=ctable
        ctable= image[center][p+firstCol][q]
    endif
    ctable *= 257   // scale to 0-65535
    Redimension/U/W ctable  // convert to 16-bit int wave

    // set dimension labels
    SetDimLabel 1, 0, red, ctable
    SetDimLabel 1, 1, green, ctable
    SetDimLabel 1, 2, blue, ctable

    // remove any unnecessary alpha column
    if( layers == 4 )
        ImageStats/M=1/G={0, DimSize(ctable,0)-1, 3, 3} ctable
        if( V_min == V_max )
            Redimension/N=(-1,3) ctable
        else
            SetDimLabel 1, 3, alpha, ctable
        endif
    endif

    return WaveExists(ctable)   // in case of error
End

Function WMGetMarqueeImageBounds(graphName, imageName, firstRow, lastRow, firstCol, lastCol)
    String graphName, imageName
    Variable &firstRow, &lastRow, &firstCol, &lastCol

    WAVE image= ImageNameToWaveRef(graphName, imageName)
    Variable rows= DimSize(image,0)
    Variable cols= DimSize(image,1)
    firstRow= 0
    lastRow= rows-1
    firstCol=0
    lastCol= cols-1

    // Use entire image
    String info= ImageInfo(graphName, imageName, 0)
    String hAxis= StringByKey("XAXIS", info)
    String vAxis= StringByKey("YAXIS", info)
    GetMarquee /W=$graphName/Z $hAxis, $vAxis
    Variable haveMarquee= V_Flag
    if( haveMarquee ) // if marquee, use subset of image
        // convert horizontal (X) coordinates to rows
        // convert vertical (Y) coordinates to cols
        Variable swap

        // if swapXY, exchange V_left with V_top, and V_right with V_bottom
        String hAxisInfo= AxisInfo(graphName, hAxis)
        String hAxisType= StringByKey("AXTYPE", hAxisInfo)
        Variable axesSwapped= CmpStr(hAxisType, "left") == 0 || CmpStr(hAxisType, "right") == 0
        if( axesSwapped )
            swap= V_left
            V_left= V_top
            V_top= swap

            swap= V_right
            V_right= V_bottom
            V_bottom= swap
        endif

        firstRow= (V_left-DimOffset(image,0))/DimDelta(image,0)
        lastRow= (V_right-DimOffset(image,0))/DimDelta(image,0)
        if( firstRow > lastRow )
            swap= firstRow
            firstRow= lastRow
            lastRow= swap
        endif
        if( firstRow < 0 )
            firstRow= 0
        endif
        if( lastRow > rows-1 )
            lastRow= rows-1
        endif
        firstRow= floor(firstRow)
        lastRow= ceil(lastRow)

        firstCol= (V_top-DimOffset(image,1))/DimDelta(image,1)
        lastCol= (V_bottom-DimOffset(image,1))/DimDelta(image,1)
        if( firstCol > lastCol )
            swap= firstCol
            firstCol= lastCol
            lastCol= swap
        endif
        if( firstCol < 0 )
            firstCol= 0
        endif
        if( lastCol > cols-1 )
            lastCol= cols-1
        endif
        firstCol= floor(firstCol)
        lastCol= ceil(lastCol)
    endif
    return haveMarquee
End

Function WMDemoColorTableWave(WAVE ctable)

    Variable rows= DimSize(ctable,0)
    String name= NameOfWave(ctable)
    String graphName= CleanupName("CTabDemo"+name,0)[0,30]
    String demoWaveName= CleanupName(name+"Img",0)[0,30]
    Make/O/N=(rows, 30) $demoWaveName= p // simple ramp
    WAVE img= $demoWaveName
    DoWindow/F $graphName
    if( V_Flag == 0 )
        Newimage/N=$graphName img
        ModifyImage/W=$graphName ''#0, ctab={*,*,ctable} // apply color table wave
    endif
    ModifyGraph/W=$graphName nticks=0, width=300, height=40, axThick=1
End

Forum

Support

Gallery
Igor Pro 10
Learn More
Igor XOP Toolkit
Learn More
Igor NIDAQ Tools MX
Learn More