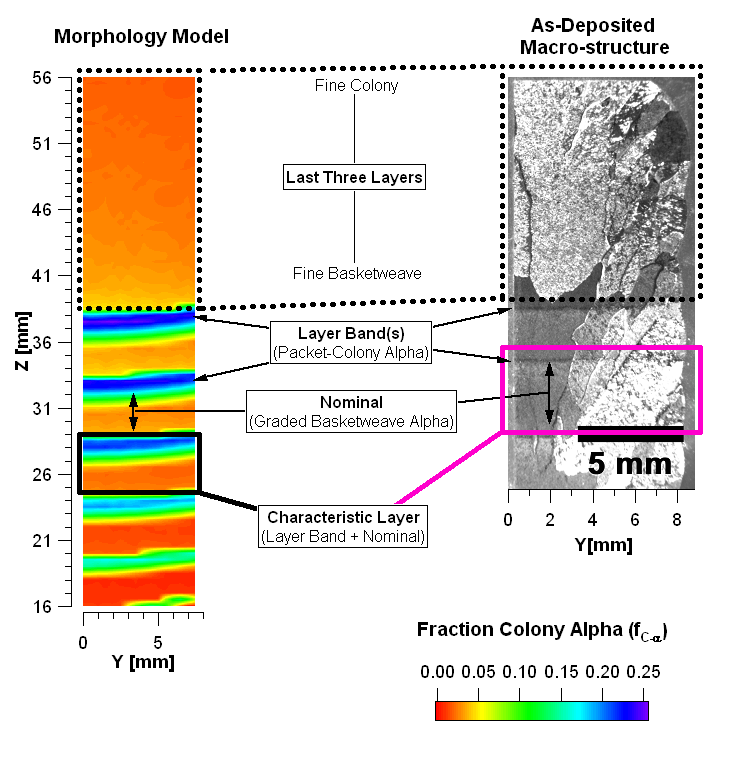
Comparison of modeled and as-deposited microstructure

Comparison of the modeled (fraction colony-alpha phase) and as-deposited macrostructure of a Ti-6Al-4V part fabricated using an additive laser deposition process.
The graph shows the modeled periodic variation in the amount of colony alpha phase present, in agreement with the layer band morphology of the as-deposited macro-structure. Further details may be found at: https://link.springer.com/article/10.1007/s11661-004-0094-8
This graph highlights several of Igor Pro's unique plotting and calculation capabilities. The modeled data is shown as an image map that has been interpolated from a coarser resolution using the Matrix2Matrix command. The experimental macrograph is an imported TIFF image, displayed on separate horizontal and vertical axes. In addition, extensive drawing tools were used to highlight the pertinent features on the graph.
Submitted by S.M. Kelly of Oak Ridge National Laboratory and Virginia Tech.

Forum

Support

Gallery
Igor Pro 9
Learn More
Igor XOP Toolkit
Learn More
Igor NIDAQ Tools MX
Learn More


