"Waterfall" plot for X-Y1-Y2 data
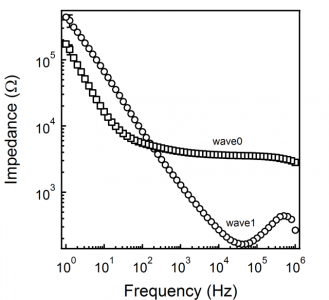
I have data in the form X-Y1-Y2. The attached picture will hopefully make this more clear. These data were collected at a given temperature, and I have analogous data sets for a series of temperatures. I'd like to visualize how these data change with temperature by plotting them on a 3D plot. That is, I'll show each X-Y1-Y2 data set, but spread out along a third Temperature axis. Again, I've been researching the NewWaterfall command, but it isn't obvious to me how this will work for my situation.
Any help will be appreciated.


An alternative is to create a "fake waterfall plot" using XY pairs. See http://www.igorexchange.com/node/2538.
September 21, 2012 at 06:52 am - Permalink