
User-defined Fit Function

neima.allah.hosni
Hi everyone,
I’ve been using Igor for almost 2 years now, but I'm still a beginner when it comes to understanding it.
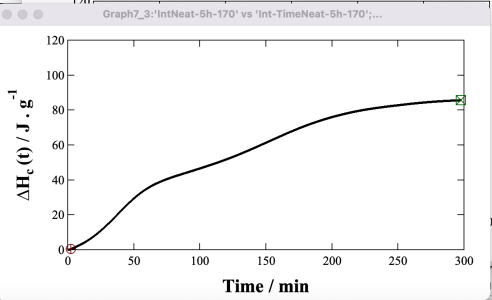
I have a crystallization curve, which I need to fit using the Avrami equation. So I tried to input it as user-defined fit function.
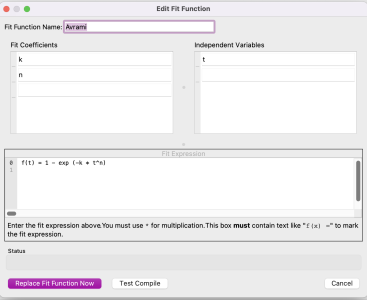
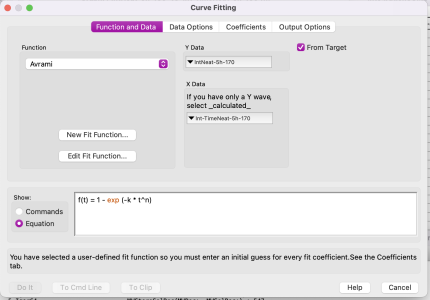
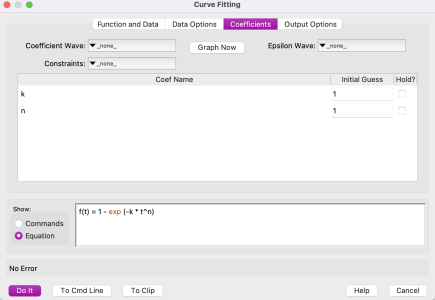
Now whenever I try it, it gives me "Syntax Error", I am not sure what the problem is, the function or the initial guesses?
I am attching pictures, hope you can help please.
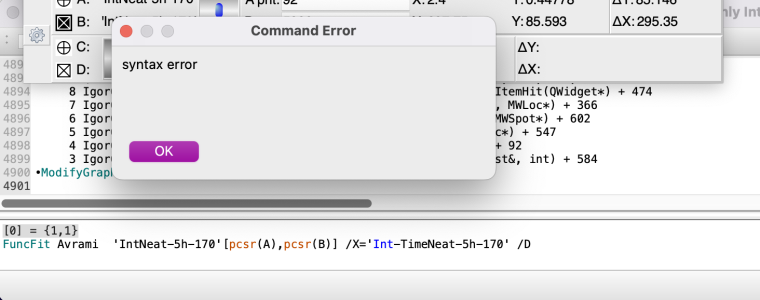


Your fit has two issues, I think:
•W_coef[0] = {1,1}and not just [0] = {1,1}.
Which Igor version are you using, and did you get this bug before? How did you trigger this? Can you provide a minimal example file?
The second problem is that your function is not well defined. If you write something like k*t, which are both fit parameters, then the fit can vary k in a way that compensates for t. This will give a fit error. You would need to fix either k or t, or define the problem in a way which does not have interdependent variables (such as defining a combined kt parameter).
October 12, 2023 at 03:34 am - Permalink
Since you are fitting the data over the entire span of time, you likely need not use the pcsr(...) limitations in the call to the fit function. I suggest also that you show your curve as data points rather than as a smooth line, primarily so that you can distinguish the line that will show results from the fit.
The syntax error is from the input [0]= ... as chozo noted.
Finally, the Avrami equation has bounds between 0 and 1. See the example plot below. Your data are not suited to use this equation. Do one of two things: a) include an additional scaler multiplier A in the function f(t) = A*(1 - ...) or b) rescale the y data wave to be bounded between 0 and 1 (i.e. normalize the data by dividing it by the maximum in the wave).
October 12, 2023 at 06:56 am - Permalink
Hello,
Thank you very much @chozo and @jjweimer for taking the time to answer my question.
- I am using Igor Pro 9. I am not sure what is a "minimal example file" or how to obtain it.
- K is a constant, should I fix it by "hold" in the coefficient tab? or is there another way to better define the equation itself?
I changed t to x because t is the x wave data. I did as suggested and divided the data by the max. I added "•W_coef" manually to the command line and fixed k by "hold" in the coefficient tab. Now I got a new error of "expected wave name".
I would truly appreciate if you can explain what I did wrong and how to fix it if you can please.
Thanks a lot.
October 14, 2023 at 02:47 am - Permalink
Nice, that is some progress. I guess the error occurs because Igor cannot find the input waves. Have you changed the data folder within Igor in the meantime? The current folder should be set to the one which contains IntNeat-5h-170 and Int-TimeNeat-5h-170.
With "minimal example file" I mean an Igor experiment file with only the data in question and all necessary code, graphs etc. to show the problematic behavior. You could upload something like this here, so that we can try ourselves. Some people just upload their file as is, but usually such files are full of unrelated clutter which makes it more difficult to identify the problem.
October 14, 2023 at 03:13 am - Permalink
You should not fix k. Indeed, I expect you will get singularities if you fix k.
Please show the measured data as points not lines. I am especially concerned by whether your data have two overlapping Avrami kinetics (from 0% to 50% conversion and from 50% to 100% conversion) or whether your data simply has significant scatter in measured values.
Here is the Avrami Equation Plot experiment that I used to generate the graph in my previous post. Attach a MWE (minimum working example) in the same way.
October 14, 2023 at 07:59 am - Permalink
In reply to You should not fix k. Indeed… by jjweimer
Thanks a lot for your reply and the attached example.
The graph I attached before is displayed as points not lines, it is a crystallization curve so it has over 5000 data point.
I am trying to fit the original crystallization curve with the Avrami equation because when I did the known method of plotting "log (-ln (1-φ(t)/φ∞))" vs "log (t-t0), I got n value of lower than 1.
October 15, 2023 at 02:58 am - Permalink
In reply to Nice, that is some progress… by chozo
I did not change anything in the wave names, I even tried it from scratch in a new experiment file, but got the same result.
I will try again, hoopefully it will work. And I will try to clean up the experiment file to contain only the relevant data and upload it here as you suggested.
Thanks a lot, much appreciated.
October 15, 2023 at 03:01 am - Permalink
With the resolution in your data, I would wonder whether you have two kinetic regions. One happens up to 100 min and the other thereafter. A higher confidence in the variability in the results would be gained by averaging experimental data over replicate experiments.
October 15, 2023 at 07:32 am - Permalink