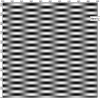
Tag on image remains visible always?
I'd like to tag each point of an image with its z-value.
I'd also like the tags to disappear when their points are off-screen.
BUT when using the Tag command, even with the "invisible" flag /I=1, the tag remains at the edge of the graph.
Some example code:
  Make /N=(1024, 1024) Junk = sin(p/10)*cos(q/10)
  NewImage Junk

  Tag /C/N=text0/I=1/L=0 Junk, 820100, "Here's the tag!"
  SetAxis top 300, 500
The tag remains on the edge of the image, as if the /I flag were 0... For a graph of a 1-D wave, tags disappear as expected.
Help?
Thanks,
Dave


I'll probably be able to fix this in a day or so.
Larry Hutchinson
WaveMetrics
support@WaveMetrics.com
October 21, 2013 at 12:21 pm - Permalink
FYI, here's an example experiment containing the little routine I wrote to tag an image.
I'm far from an expert programmer so welcome any suggestions or comments you might have (try not to laugh too hard)...
I'm also trying to visualize my data using Gizmo. Is there a way to make a 3D bar graph using Gizmo?
The default surface plot smooths out the data, but what I analyze only has trends in one direction (along rows), and so it's a little misleading.
I've tried waterfall plotting using Bars mode (in attached .pxp), but have the overwhelming urge to rotate and manipulate via mouse as you can with Gizmo. Seems like there'd be a way to do this in Gizmo but maybe I'm missing it.
Cheers,
Dave
October 23, 2013 at 03:02 pm - Permalink
I'm also trying to visualize my data using Gizmo. Is there a way to make a 3D bar graph using Gizmo?
[/quote]
You should really post this under a new heading as it is completely unrelated to the current thread.
[quote]
The default surface plot smooths out the data, but what I analyze only has trends in one direction (along rows), and so it's a little misleading.
[/quote]
Gizmo does not smooth data. Your surface consists of single data values yet you expect Gizmo to guess that you want to describe each data point by 8 vertices... Gizmo is just not that good at reading your mind so to help it along you can convert your data into a parametric surface where each pixel value is mapped into 8 xyz triplets (4 for the base of the bar and 4 for the top). Here is example code to do that:
I hope this helps,
A.G.
WaveMetrics, Inc.
October 21, 2013 at 03:17 pm - Permalink
FYI, here's an example experiment containing the little routine I wrote to tag an image.
I'm far from an expert programmer so welcome any suggestions or comments you might have (try not to laugh too hard)...
Dave[/quote]
Your procedure was in an external procedure so I could not comment on it. Next time, be sure to adopt (File menu) any external procedure files or hold the shift key to adopt all.
It was more involved than I expected but I was finally able to get tags on images to honor the invisible if off-scale mode. I verified this with your experiment.
The next (tomorrow's) nightly build will have this change. You can get the nightly build here:
http://www.wavemetrics.net/Downloads/latest/
Larry Hutchinson
WaveMetrics
support@WaveMetrics.com
October 22, 2013 at 09:29 am - Permalink
Thanks for the changes to the code -- I downloaded the latest build and works great.
AG, I've reposted the topic under a different heading with a link to your reply above.
Thanks,
Dave
October 24, 2013 at 02:23 pm - Permalink