Shading for error bars in x-axis


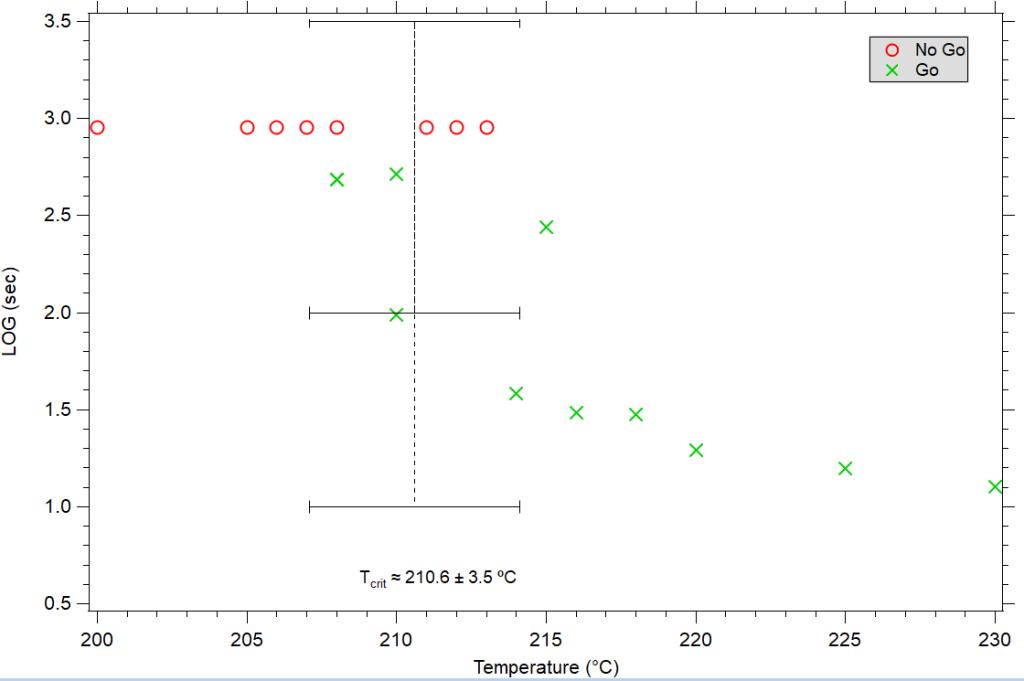
I have a simple x-y plot with a vertical line with x-axis error bars. I'd like to make a vertical column of shading in place of the x-error bars. I'm using a fixed value for the +/- error. The option to use the x-axis for shading goes to "not applicable" when I try to switch from bars (see image) to shading. Please go easy on the coding! I never use the command window.
Using Igor Pro 9.0.5.1 (Build 56551) on Windows 11.
Hi Jason,
One simple way is to create a 2 point wave with the value of 3.5 in your case and then set the scale to be the range of your error bars.
Add the wave to the graph and set the mode to fill to zero and set the fill to 25%. Send that trace to the back and the other points will go over the band.
Andy
May 29, 2024 at 05:04 pm - Permalink
In reply to Hi Jason, One simple way is… by hegedus
Thanks for the simple workaround, but I'm a bit confused. How do I have 2 points with a single value of 3.5? I figured the 2 points would both have 210.6 as the x value, then y values of 0 and 3.5 to make a vertical line that would be replaced by shading. I'm also not seeing any scale function on the trace appearance. There is fill type (+/-) and color (+/-) under Bars, but that's it.
Any idea why we need to work around this? Why can shading only be used on the y-axis but not the x?
May 30, 2024 at 07:06 am - Permalink
Hi Jason,
I can't speak to why error bars are constrained to y axis in the program, though your example shows a single error bar and not a per point error bar as is idea/intent in the trace modification dialog.
As for my workaround, I am taking advantage of a couple features to define the box. For x values defining the left and right edge of the shaded box, I am using the wave scaling feature to imbed those values. Since I have two points the offset in scaling represents the left x value and the delta represents the difference between the left and right edge. For the top and bottom, I again take advantage of a feature and use the fill from zero mode for the trace which gives me 0 as the lower Y value. The reason I have single value, 3.5, in this case is that represents the upper edge of the box.
Hope this helps.
Andy
May 30, 2024 at 08:05 am - Permalink
Sounds like you just want a colored box on your graph. If you want to use error bar shading, you will need to apply the /VERT flag to the trace with the error bars. If you do that, the restriction on error bar shading turns into an X-direction shading.
Another way to do it would be to use the drawing tools to create a shaded box. Set the coordinate system for the box to axis coordinates so that it is positioned on the graph relative to the axes. That allows you to think in the units you want to think in, and it means the box will adjust if the axis ranges change.
May 30, 2024 at 09:31 am - Permalink
Nice! I like these suggestions, too. I figured there were multiple ways to get what I needed. Is that flag something I need the command window for? I'm not familiar with doing that.
I try drawing the box and it isn't working. I use the box tool to throw a basic rectangle on the plot, then switch to the selector tool to double click on it. I then set both x and y to axis relative and put in the x-y coordinates of the points. I'm assuming these x and y values for the edges. On clicking Do It, the rectangle disappears.
Thanks.
May 30, 2024 at 10:50 am - Permalink
In the New Graph dialog and Append to Graph dialog there is a checkbox between the two wave lists aligned with the bottom of the lists. "Swap Trace X & Y Axes"
May 30, 2024 at 11:09 am - Permalink
In reply to Nice! I like these… by jasonjphillips
To use the drawing method, make sure the drawing is in one of the back layers, and select 'plot relative' for y coordinates and 'axis bottom' for x coordinates. Y values will be 0 and 1 to fill the graph top-to-bottom.
May 31, 2024 at 01:59 am - Permalink
In reply to To use the drawing method,… by tony
That works, but why is there a margin on the top and bottom of the box where it approaches the x and mirrored x-axes? If I physically move the box, I can get it right up against the axes, but not using the methods given.
May 31, 2024 at 06:55 am - Permalink
That's called "axis standoff", a unique feature of Igor. It avoids having the markers fall on top of the axes. Double-click the bottom axis, select the Axis tab and un-check "Axis Standoff".
If you like the axis standoff, in Igor 9 you can choose "Axis Relative" for the Y coordinates to get the box to extend all the way to the axes.
May 31, 2024 at 09:41 am - Permalink
I never would have found that on my own. Thank you!
June 3, 2024 at 08:28 am - Permalink
There's a whole pile of stuff to find in Igor! Keep asking questions...
June 3, 2024 at 09:24 am - Permalink