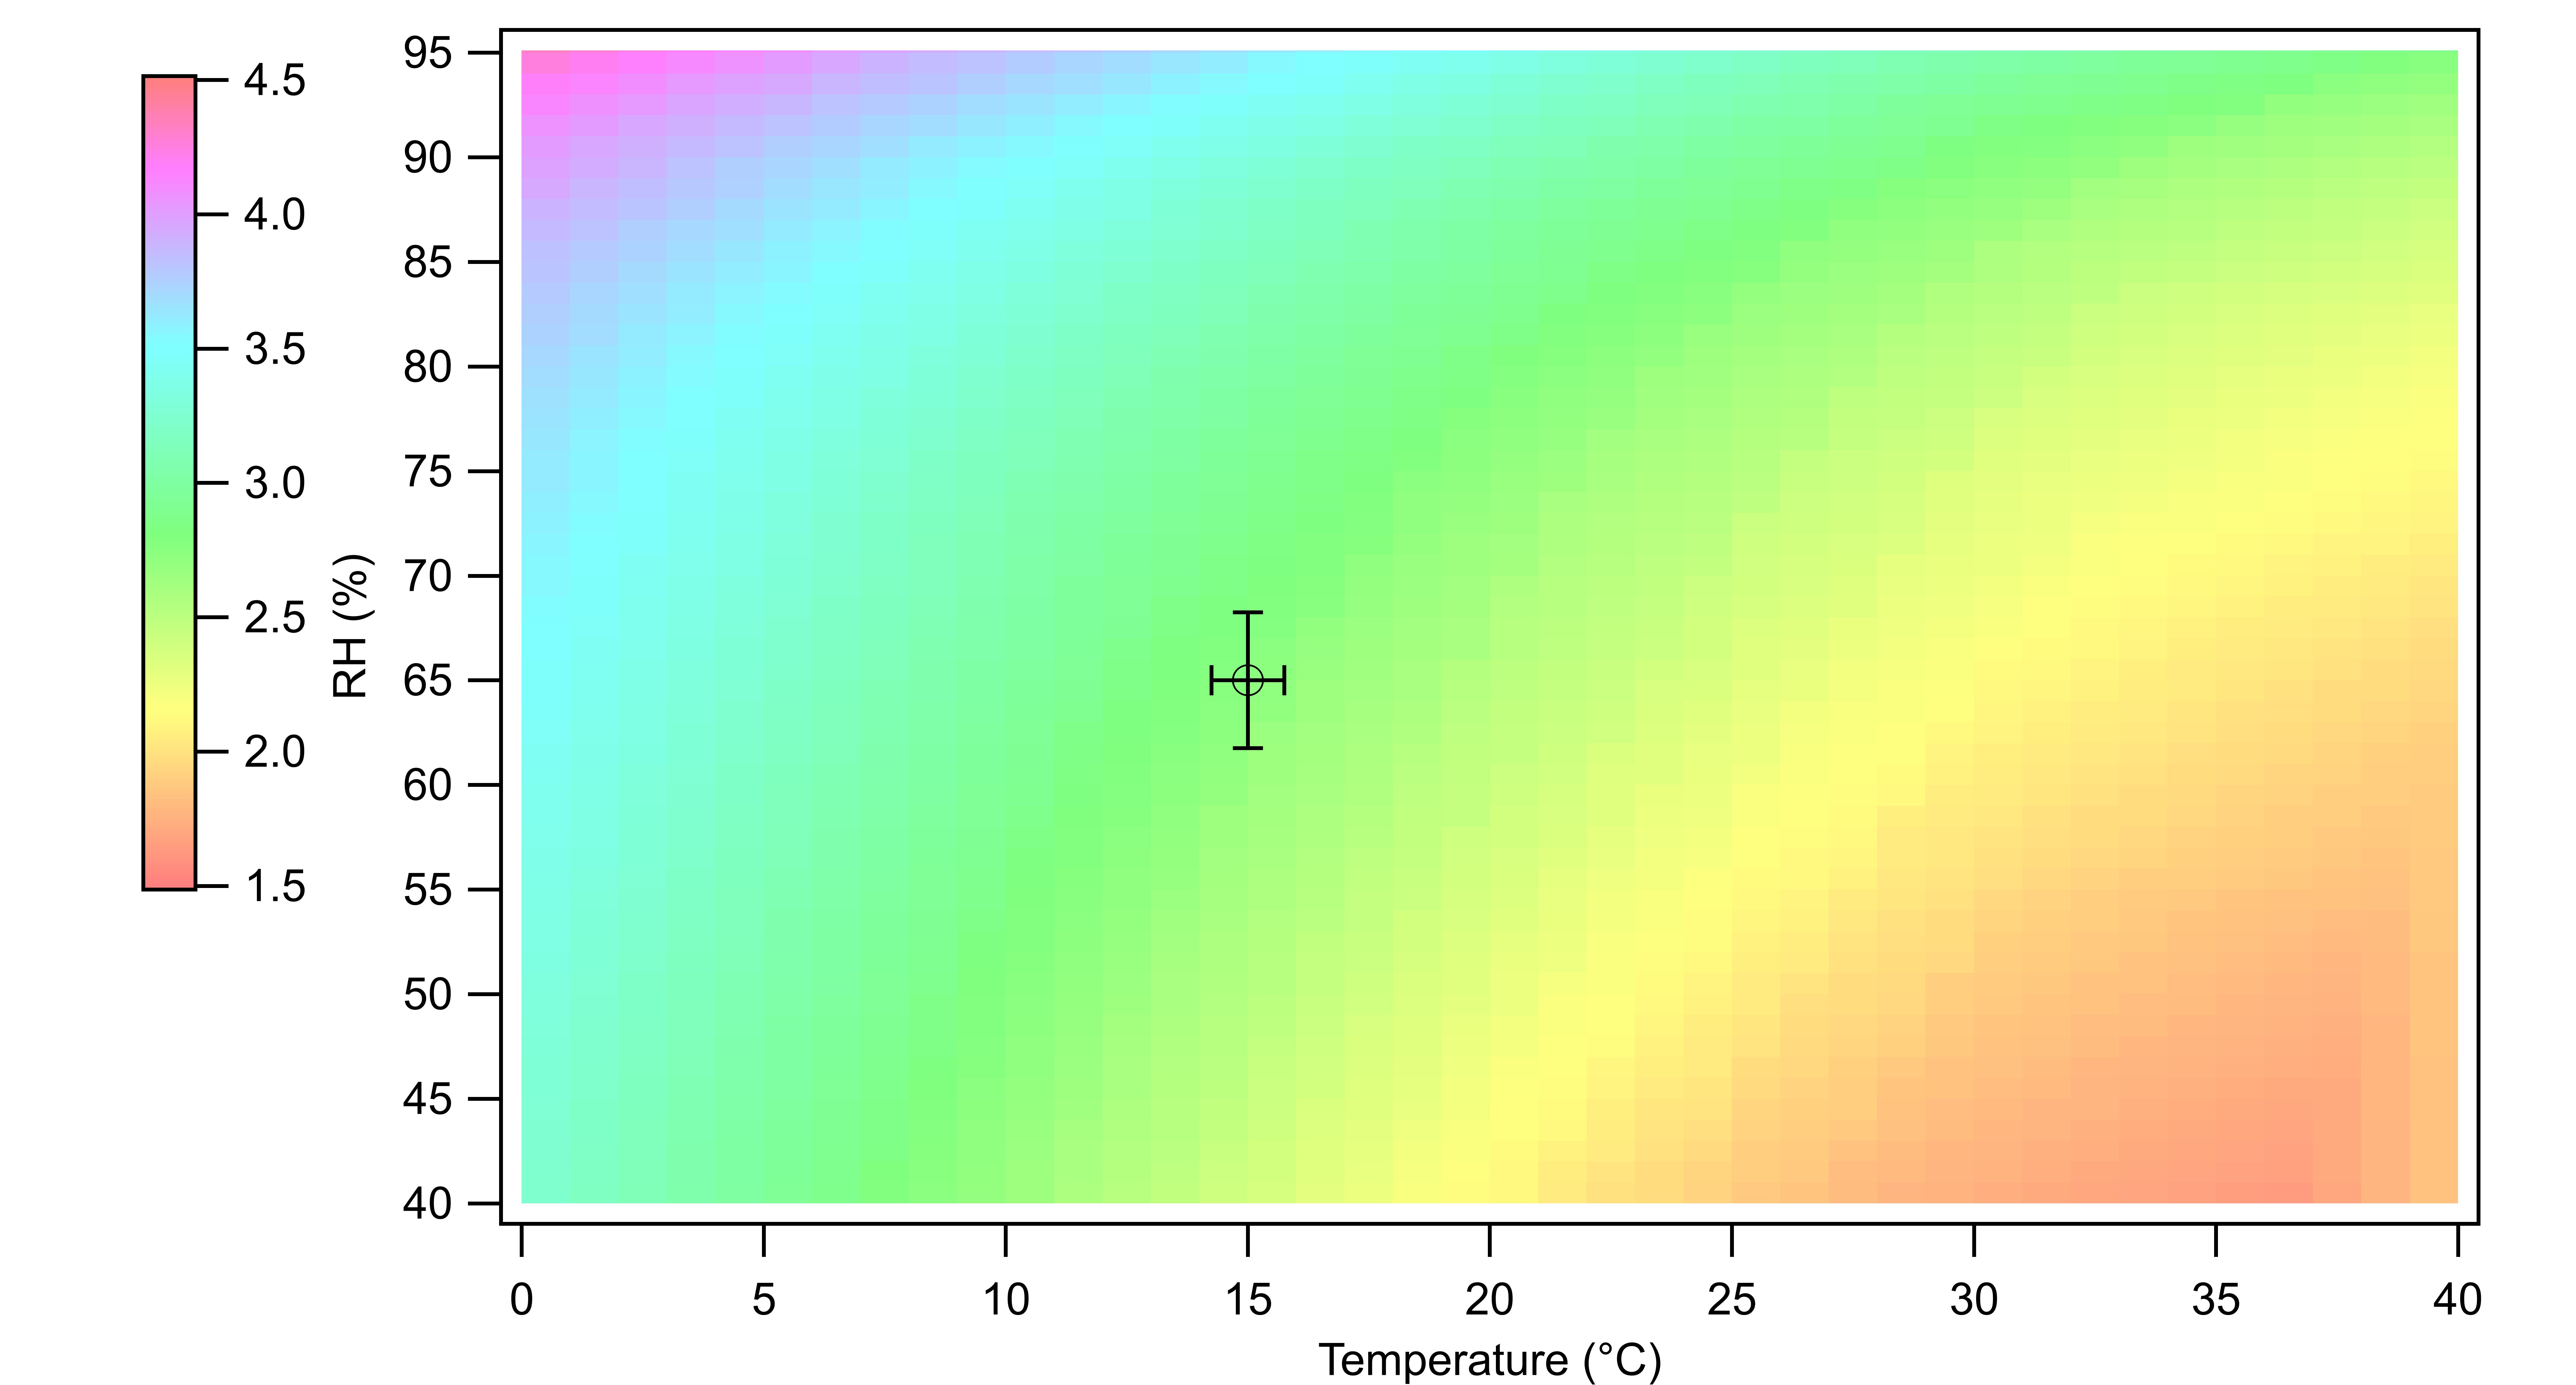
Removing white background around image plot showing 2D matrix


I have created a image plot showing a 2D matrix. I want to append some traces onto this image plot. However, I indicated that the the trace is to be shown as markers, a white border suddenly appears between the matrix plot and the x and y axes (see attached). The only way I can make that white border disappear is if I were to remove the trace that I appended onto the image plot. How do I remove this white border while keeping the trace on the image plot?
in the modify axis dialog uncheck the standoff checkbox, or execute
August 18, 2022 at 02:47 am - Permalink