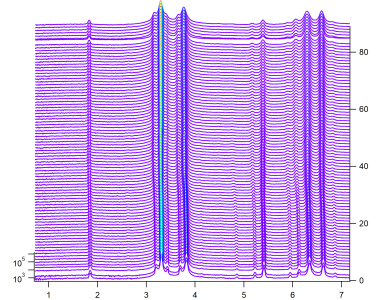
The problem of disordering lines in waterfall graph
Hello,
I came across a problem with the waterfall figure. When I concatenate a series of data into a matrix and use the new waterfall command to show the waterfall figure, the lines somewhere seem to have some problems. For example, line 2 and line 84 seem to be disordered. But not every figure has this problem.
Could you please help deal with the question? Thank you.
Best regards
Jack


When I zoom in on the image, the problem seems to disappear. See the image below. I do not know why.
October 13, 2024 at 08:04 pm - Permalink
Does the issue toggle when you change the size of the graph or the distance between traces? Would it be possible to post an example experiment file? Which version of Igor and OS are you using? You could also create an alternative 'fake' waterfall by just plotting all traces yourself and then offsetting them via trace offset.
October 13, 2024 at 08:40 pm - Permalink
Hi, chozo,
Thanks for dealing with my question.
The issue persists when the size of the graph changes. I currently do not know how to change the distance between traces. But when I zoom in on the problematic area, as I said, it turns to fine. My version is IGOR PRO 9.04, 64-BIT. My computer is Windows system.
I built a matrix using the concatenate command in another file, but the result was fine. Interesting. See the figure. in this case, there are 71 traces, less than the former figure.
Thank you.
The following contents are commands I input in command window.
•Concatenate {HR70Cr2h01_1, HR70Cr2h02_1, HR70Cr2h03_1, HR70Cr2h04_1, HR70Cr2h05_1, HR70Cr2h06_1, HR70Cr2h07_1, HR70Cr2h08_1, HR70Cr2h09_1, HR70Cr2h10_1, HR70Cr2h11_1, HR70Cr2h12_1, HR70Cr2h13_1, HR70Cr2h14_1, HR70Cr2h15_1, HR70Cr2h16_1, HR70Cr2h17_1, HR70Cr2h18_1, HR70Cr2h19_1, HR70Cr2h20_1, HR70Cr2h21_1, HR70Cr2h22_1, HR70Cr2h23_1, HR70Cr2h24_1, HR70Cr2h25_1, HR70Cr2h26_1, HR70Cr2h27_1, HR70Cr2h28_1, HR70Cr2h29_1, HR70Cr2h30_1, HR70Cr2h31_1, HR70Cr2h32_1, HR70Cr2h33_1, HR70Cr2h34_1, HR70Cr2h35_1, HR70Cr2h36_1, HR70Cr2h37_1, HR70Cr2h38_1, HR70Cr2h39_1, HR70Cr2h40_1, HR70Cr2h41_1, HR70Cr2h42_1, HR70Cr2h43_1, HR70Cr2h44_1, HR70Cr2h45_1, HR70Cr2h46_1, HR70Cr2h47_1, HR70Cr2h48_1, HR70Cr2h49_1, HR70Cr2h50_1, HR70Cr2h51_1, HR70Cr2h52_1, HR70Cr2h53_1, HR70Cr2h54_1, HR70Cr2h55_1, HR70Cr2h56_1, HR70Cr2h57_1, HR70Cr2h58_1, HR70Cr2h59_1, HR70Cr2h60_1, HR70Cr2h61_1, HR70Cr2h62_1, HR70Cr2h63_1, HR70Cr2h64_1, HR70Cr2h65_1, HR70Cr2h66_1, HR70Cr2h67_1, HR70Cr2h68_1, HR70Cr2h69_1, HR70Cr2h70_1, HR70Cr2h71_1, HR70Cr2h72_1, HR70Cr2h73_1, HR70Cr2h74_1, HR70Cr2h75_1, HR70Cr2h76_1, HR70Cr2h77_1, HR70Cr2h78_1, HR70Cr2h79_1, HR70Cr2h80_1, HR70Cr2h81_1, HR70Cr2h82_1, HR70Cr2h83_1, HR70Cr2h84_1, HR70Cr2h85_1, HR70Cr2h86_1, HR70Cr2h87_1, HR70Cr2h88_1, HR70Cr2h89_1}, Alldata•newwaterfall alldata vs {HR70Cr2h01_0, *}•ModifyGraph zColor(Alldata)={Alldata,*,*,Rainbow256,1}October 13, 2024 at 11:52 pm - Permalink
Dear Chozo,
The problem has been solved. It was related to my data. the backgrounds of the data in the two traces were doubled compared with other traces. Thank you.
Best
JACK
October 14, 2024 at 12:41 am - Permalink
Ok great!
October 14, 2024 at 03:02 am - Permalink