Problem in Asymmetric Violin Plots
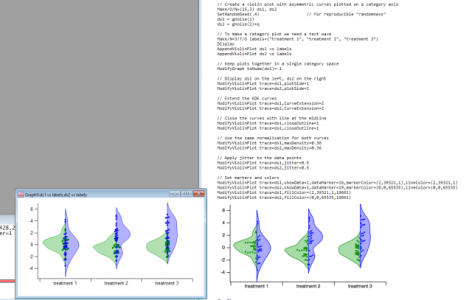
I am trying to create an asymmetric violin plot as shown in the documentation (II-273). However, I am unable to distribute the data points in one half of the violin plot (see attached image). I followed the example provided in Igor reference without success. I am doing something wrong??
Thank you!
// Create a violin plot with asymmetric curves plotted on a category axis
Make/O/N=(25,3) ds1, ds2
SetRandomSeed(.4)       // For reproducible "randomness"
ds1 = gnoise(1)
ds2 = gnoise(2)+q

// To make a category plot we need a text wave
Make/N=3/T/O labels={"treatment 1", "treatment 2", "treatment 3"}
Display
AppendViolinPlot ds1 vs labels
AppendViolinPlot ds2 vs labels

// Keep plots together in a single category space
ModifyGraph toMode(ds1)=-1

// Display ds1 on the left, ds2 on the right
ModifyViolinPlot trace=ds1,plotSide=1
ModifyViolinPlot trace=ds2,plotSide=2

// Extend the KDE curves
ModifyViolinPlot trace=ds1,CurveExtension=2
ModifyViolinPlot trace=ds2,CurveExtension=2

// Close the curves with line at the midline
ModifyViolinPlot trace=ds1,closeOutline=1
ModifyViolinPlot trace=ds2,closeOutline=1

// Use the same normalization for both curves
ModifyViolinPlot trace=ds1,maxDensity=0.36
ModifyViolinPlot trace=ds2,maxDensity=0.36

// Apply jitter to the data points
ModifyViolinPlot trace=ds1,jitter=0.5
ModifyViolinPlot trace=ds2,jitter=0.5

// Set markers and colors
ModifyViolinPlot trace=ds1,showData=1,dataMarker=16,markerColor=(2,39321,1),lineColor=(2,39321,1)
ModifyViolinPlot trace=ds2,showData=1,dataMarker=19,markerColor=(0,0,65535),lineColor=(0,0,65535)
ModifyViolinPlot trace=ds1,fillColor=(2,39321,1,19661)
ModifyViolinPlot trace=ds2,fillColor=(0,0,65535,19661)
</span>


June 26, 2018 at 10:11 am - Permalink
June 26, 2018 at 04:27 pm - Permalink
June 27, 2018 at 03:26 am - Permalink