Orientation and size of strings in Gizmo plot?

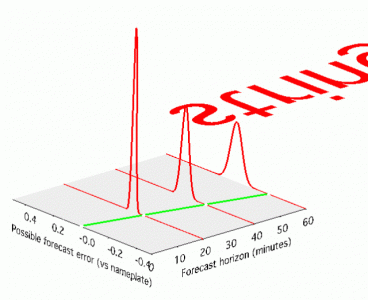
I am trying to create a 3D Gizmo plot and add some annotations describing the elements in it. However, when I add text (either via Append New Object -> String... or via Gizmo -> Append Annotation...), it only appears in one orientation and size -- large text, facing in the -z direction, with the baseline starting at the center of the 3d plot area and running in the positive x direction (see attached image).

I have searched the menus, double-clicked the text object, searched the help, etc., but can't find any way to change the size, color or orientation of this text. Does anyone have any ideas? I assume it is possible, since the graphs in the Igor Pro 3D gallery have text facing directly toward the viewer (e.g., http://www.wavemetrics.com/products/IGORPro/gallery/3dsamps_sinclair.htm or http://www.wavemetrics.com/products/IGORPro/gallery/3dsamps_Minoofar.htm).

Thanks for any help you can give!
Strings in Gizmo are (non-data) objects similar to spheres, boxes etc. As such they are drawn using default size with the origin at the origin of the drawing volume. To control the appearance of a string object I recommend the following steps:

1. Append to the bottom of display list a PushMatrix operation
2. Append to the bottom of display list a rotation operation. Set the rotation e.g., 90 degrees about the X axis.
3. Append another rotation operation e.g., 45 degrees about the Z-Axis.
4. Append a translation operation e.g., -1,0,0.
5. Append scaling operation e.g., 0.2 in X, Y and Z directions.
6. Append the String object
7. Append PopMatrix operation.

Note: Steps 1 and 7 are not always necessary but would be useful if you were to append subsequent objects to the display list.

You can find a simple example of this in the Gizmo Rotation demo under File Menu->Example Experiments->Visualization->GizmoRotation.

A.G.
WaveMetrics, Inc.
Igor wrote:
To control the appearance of a string object I recommend the following steps:

1. Append to the bottom of display list a PushMatrix operation
2. Append to the bottom of display list a rotation operation. Set the rotation e.g., 90 degrees about the X axis.
3. Append another rotation operation e.g., 45 degrees about the Z-Axis.
4. Append a translation operation e.g., -1,0,0.
5. Append scaling operation e.g., 0.2 in X, Y and Z directions.
6. Append the String object
7. Append PopMatrix operation.

Thanks very much for this advice. In retrospect, I might have figured some of this out by reading the "Visualization" help page more closely, where it notes:
Igor Help File wrote:
Like the primitive objects described above string objects are 3D objects that are drawn in absolute coordinates. As such, a typical application of a string would include additional translation and rotation operations in order to place the string at the appropriate part of the graph and in the desired orientation. The key to orienting strings correctly is understanding that they originate at the origin, the direction of character advance is in the x-direction, and the direction of line advance is in the y-direction (though multiple lines are not supported).

Anyway, following your advice, I managed to put the label where I wanted it. It took some trial and error, and I found it was easier to put the translation operation in the list before the rotation operation (to make it easier to keep track of which direction I was moving the label), but it worked out in the end.

Do you think there's any chance of adding an "Apply" button to the dialog boxes for the transformations in the Display List? That would make it easier to experiment.

Thanks very much for your help! The current results are attached.
3d and 2d curves with a label.png (20.1 KB)
mfripp wrote:
Igor wrote:
To control the appearance of a string object I recommend the following steps:

1. Append to the bottom of display list a PushMatrix operation
2. Append to the bottom of display list a rotation operation. Set the rotation e.g., 90 degrees about the X axis.
3. Append another rotation operation e.g., 45 degrees about the Z-Axis.
4. Append a translation operation e.g., -1,0,0.
5. Append scaling operation e.g., 0.2 in X, Y and Z directions.
6. Append the String object
7. Append PopMatrix operation.

Thanks very much for this advice. In retrospect, I might have figured some of this out by reading the "Visualization" help page more closely, where it notes:
Igor Help File wrote:
Like the primitive objects described above string objects are 3D objects that are drawn in absolute coordinates. As such, a typical application of a string would include additional translation and rotation operations in order to place the string at the appropriate part of the graph and in the desired orientation. The key to orienting strings correctly is understanding that they originate at the origin, the direction of character advance is in the x-direction, and the direction of line advance is in the y-direction (though multiple lines are not supported).

Anyway, following your advice, I managed to put the label where I wanted it. It took some trial and error, and I found it was easier to put the translation operation in the list before the rotation operation (to make it easier to keep track of which direction I was moving the label), but it worked out in the end.

Do you think there's any chance of adding an "Apply" button to the dialog boxes for the transformations in the Display List? That would make it easier to experiment.

Thanks very much for your help! The current results are attached.


Dear mfripp,

I'm occasionally doing the same work. Would you please give me a more detailed instruction?
Cheers,
Peter