make an image from regular array of x values, and 2D waves for Y and Z


I am taking data by sweeping one (X) parameter from xmin to xmax with step xstep; then for each value of x I sweep Y from a min to a max that differ for all Xs, the step remaining the same. I acquire the Z value for each (X,Y). I would like to make an image from this dataset, without any interpolation.
The pixels are therefore all the same size in X and Y, but their edges are not necessarily aligned.
Here is an example of dataset:
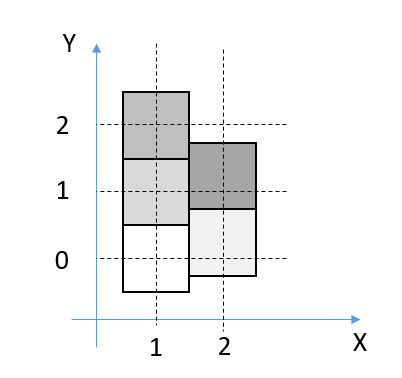
X={1,2}
Y={{0,1,2},{0.2,1.2}}
Z={{0,2,3},{1,4}}
In this example, I want to obtain an image with square, 1x1 pixels, centered at {1,0}, {1,1}, {1,2}, {2,0.2}, {2,1.2} with colors corresponding to the Z wave: 0, 2, 3, 1, 4 (see attached image, horribly drawn in powerpoint)
I did not find a way to do it, can somebody help me?
Seems like you would need to make an image using a matrix that covers the entire rectangular region of your "pixels" with many cells per "pixel". The a complicate multidimensional wave assignment could be devised to fill that matrix with the appropriate Z value depending on the X and Y values from your matrix's X and Y scaling. Fill in NaN for the cells that are outside any of your "pixels"
September 12, 2024 at 10:43 am - Permalink
After some thought, the fill of the matrix is going to be difficult...
1) It would be best to have X and Y waves that give the boundaries of the rectangles involved, i.e. `make xwave = {.5, 1.5, 2.5}`
2) Since the number of cells in the Y direction is inconsistent, you will need a separate wave for each X range. Likewise, you probably need a separate Z wave for each X range.
3) Once you have 1) and 2) in order, some code will be required to look up the appropriate Z value.
September 12, 2024 at 10:54 am - Permalink
To simplify, I can relax the constraint of having Y values than lead to shifted pixels. Let us assume that all Y values are integers, for example.
September 12, 2024 at 11:05 am - Permalink
No need- here is some code:
Here are commands that make waves that match your data above:
And a command to make the output image wave (probably you will have more than two y and z waves, so you will need to write some code/commands to make the image wave):
And, finally, the command to invoke the code:
A recreation macro for an image display using the image wave created above:
September 12, 2024 at 11:21 am - Permalink
I'd propose this approach.
* Create code to draw a box that is 1 wide by 1 tall with fill rgb color.
* Create code to put a box at a centered point (x, y).
* Iterate over the (x, y) coordinates, calling the box code to center the box at each (x, y) with the given rgb/grayscale color.
This is not an image, it is a set of graphic boxes.
I'd suggest also trying to put square markers of size N at the (x, y) positions, increasing N until the pixels just touch. Then, use an f(z) wave to set the grayscale or color of each marker. Again, not an image, instead a set of neighboring square boxes.
September 12, 2024 at 06:35 pm - Permalink
Could you make similar display as regular cartesian graph by using square markers and f(z) color from the Z values?
You have bunch of Z values, each with its own x and y. Create waves for Zvalues, Xvalues, and Yvalues. As you collect the data, for each Z value store it in Zwave and store also X and Y values in their waves. This creates simple triplet of waves with the data. Plot Ywave vs Xwave and use Zwave as color wave. I tried with marker square (marker=16) and with some playing with size it looked reasonable.
September 12, 2024 at 06:51 pm - Permalink
In reply to No need- here is some code: … by johnweeks
Excellent, Johnweeks! Exactly what I wanted, and written in a compact, elegant code. I am really greatful, thank you for taking the time to answer me and writing the full macro. I also learn in the way you write the procedure, I never used this wave/wave, and I would not have come to the idea of filling the imagewave in a single line by writing it simply as a function of x,y. Thank you!
Thank you also to jjweimer and ilavsky for their clever suggestions, which would also work, but I like to fabricate an image that I can easily modify (color scales, zooms, etc.) with all the image tools.
September 13, 2024 at 06:12 am - Permalink