How to remove minor-tick labels on Log axis?


Hallo,
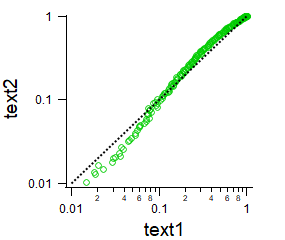
I plot normalized data on a log-log plot. Settings for both axis are identical as far as visible in the modify axis context menu. However:
On the x- axis I got minor and major ticks and numbers, on the y-axis I have only major ticks and numbers.
Is there a way to remove the minor-tick numbers on the x-axis of a log scale?
Is there a way to add the minor ticks ony the y-axis on a log-scale?
(I am using an old Igor 7)
Thanks for any hints!
Ralf
PS: I can provoke some of the desired effect byy removing axis labels or adding lines to them - I woudl like to do this more controlled.
should do the job. You may need to play with the actual number.
March 13, 2023 at 09:17 am - Permalink
On the Modify Axis dialog, Tick Options tab, set Max log cycles with minor ticks from auto to 1. This work for Ver9.
March 13, 2023 at 11:42 am - Permalink
In reply to ModifyGraph logticks(bottom)… by ChrLie
Thanks, that did the job !
Best
Ralf
March 14, 2023 at 12:48 am - Permalink