How to draw a line at a specific x or y-axis position
I would like to know in a figure how can I draw a line at any given x or/and axis position.
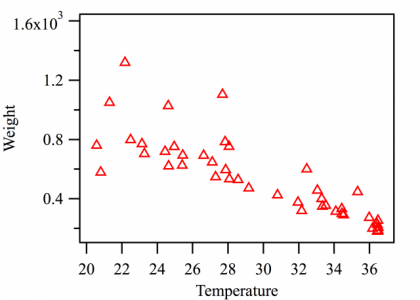
I attached a figure as an example. How can I draw a dash line at temperature = 30 (or at weight = 1.0x10^3, the line will be horizontal in this case). I know one straightforward way is to add a column of data with fixed x or y value, and then append the data into the figure. But is there any other easier way to do it?
Thanks!!


February 4, 2013 at 09:44 am - Permalink
This is exactly what I want!! Thank you so much!!
February 4, 2013 at 10:56 am - Permalink
http://www.igorexchange.com/node/3171
February 4, 2013 at 03:16 pm - Permalink