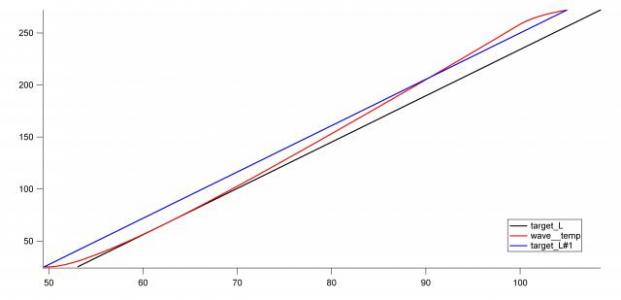
How can I create a wave like that?

daviddoji
I can create the blue wave , taking the initial and the final point from my experimental wave and interpolating it, in order to have the same number of points.
Actually, what I really would need is a wave like the black one, which has been moved clicking with the mouse over the blue wave.
Is there any way to make this?
Thanks in advance


Why would you want to move the black wave to overlap with the blue one, when you've already created the blue one? This makes no sense.
It sounds to me that you want a best fit, linear curve to your experimental data (use curve fitting). Analysis-> Quick fit -> Line
If this is not what you are asking, please provide more information.
February 11, 2013 at 09:06 am - Permalink
What I want to say is that I can create the blue one, but not the black one!
The black one is just a line, I mean, it has no points which define it! I can put the black line just moving to the right the blue wave.
I hope now it is more clear what I'm trying to say.
February 11, 2013 at 11:30 pm - Permalink
1) Copy your red wave, either by selecting the wave in the data browser, hitting 'ctrl+d', and then renaming the wave, or via command line by typing 'duplicate wave_name_of_red_wave new_wave_name'. The purpose of this step is to get a wave with the same scaling and number of points as your experimental data.
2) Find out by how much you have shifted your black line. You can double-click the line and look in the menu for the 'offset' checkbox and see what value is set as x-offset.
3) Assign values to your wave copy as a linear function. Let's assume your wave copy is called 'black'. Type 'black = your_slope * (x - your_x_offset)' into the command line. The 'x' here refers to the x-scaling of the wave, and is inserted by Igor automatically to compute the expression.
If you would like to learn more about this kind of wave manipulation, type 'DisplayHelpTopic "Waveform Arithmetic and Assignment"' into the command line.
February 12, 2013 at 05:34 am - Permalink
To understand this you need to know about the "waveform" concept. The best way to learn this is to do the Igor guided tour or at least the first half of it. You can do this by choosing Help->Getting Started.
You also can read about waveforms by executing:
February 12, 2013 at 06:22 am - Permalink