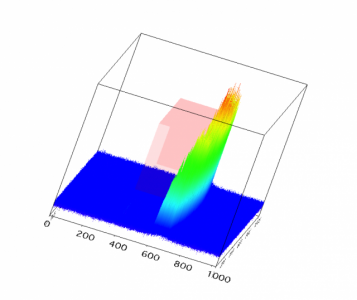
Gizmo Drawing Object coordinates relative to axes

Dave_S
For example, in the attached image I would like to position the pink box so it encapsulates all points on the surface within 633 < x < 740 and 405 < y < 535. The z-value can range the height of the plot. This might be analogous to, for 2D plots, "SetDrawEnv xcoord=bottom, ycoord = left".
Thanks!
Dave


It would be better to work with a full experiment just in case there are some details that you are not sharing with us.
Here is a very simple example that should illustrate a simple box that contains all the data:
So, as long as you have not changed the aspect ratio of the graph, your box inscribes the coordinate axes exactly. If you now want to shift the box such that it is centered elsewhere and its dimensions are different you need to insert in the Display List a Translate() operation and modify the box parameters (or scale the box) so that it covers the range that you want. For example, if you want the box to cover the range x1 to x2 in the x-direction, you need to translate it to be centered on the scaled data position xc=(x1+x2)/2. To determine the scaling you need to know the global xmin and xmax of the data. You can find these from Gizmo Menu->Axis Range or you could execute GetGizmo with the keyword dataLimits or userBoxLimits, as appropriate. The actual scaling is then obtained from:
with similar expressions for the y and z components.
If you started with a box of size 2 (as in my example above) you can add a Scale operation on the display list just above the box0 item and provide the scaling, e.g., (x2-x1)/(xmax-xmin) for the x-direction, etc.
I hope this helps,
A.G.
WaveMetrics, Inc.
June 20, 2013 at 03:03 pm - Permalink
Thanks for the speedy reply! Your recommendations were spot-on. I guess the trick is just mapping the data scale to the object scale. My results of playing around with this are in the attached experiment. A few questions:
1) I'd like to move the box programmatically, and have tried doing this by issuing:
variable x_translate = 0.342131, y_translate = -0.0791789
ModifyGizmo SetDisplayList = 5, Operation=translate, data={x_translate, y_translate, 0}
but this sets the values of the translate to an incorrect number (something times E-23 or so). What am I missing?
2) I also tried translating the box using:
ModifyObject opname=box0, operation=translate, data={0.342131, -0.0791789, 0}
but this seems to move the box off-screen. Do the values in data work the same as the values for the DisplayList operation?
As an aside, I noticed a bit of "sticky" behavior with the InverseSurfaceCTab property, and also the checkbox in the surface info dialog box. It seems to only invert the colortable after the surface's alpha value has been modified. After that it works reliably. Maybe a bug? Or just my installation perhaps.
Thanks again,
Dave
June 21, 2013 at 02:00 pm - Permalink
AG
June 24, 2013 at 10:34 am - Permalink