Duplicating data on Scatter Dot Plot when reopening Experiment


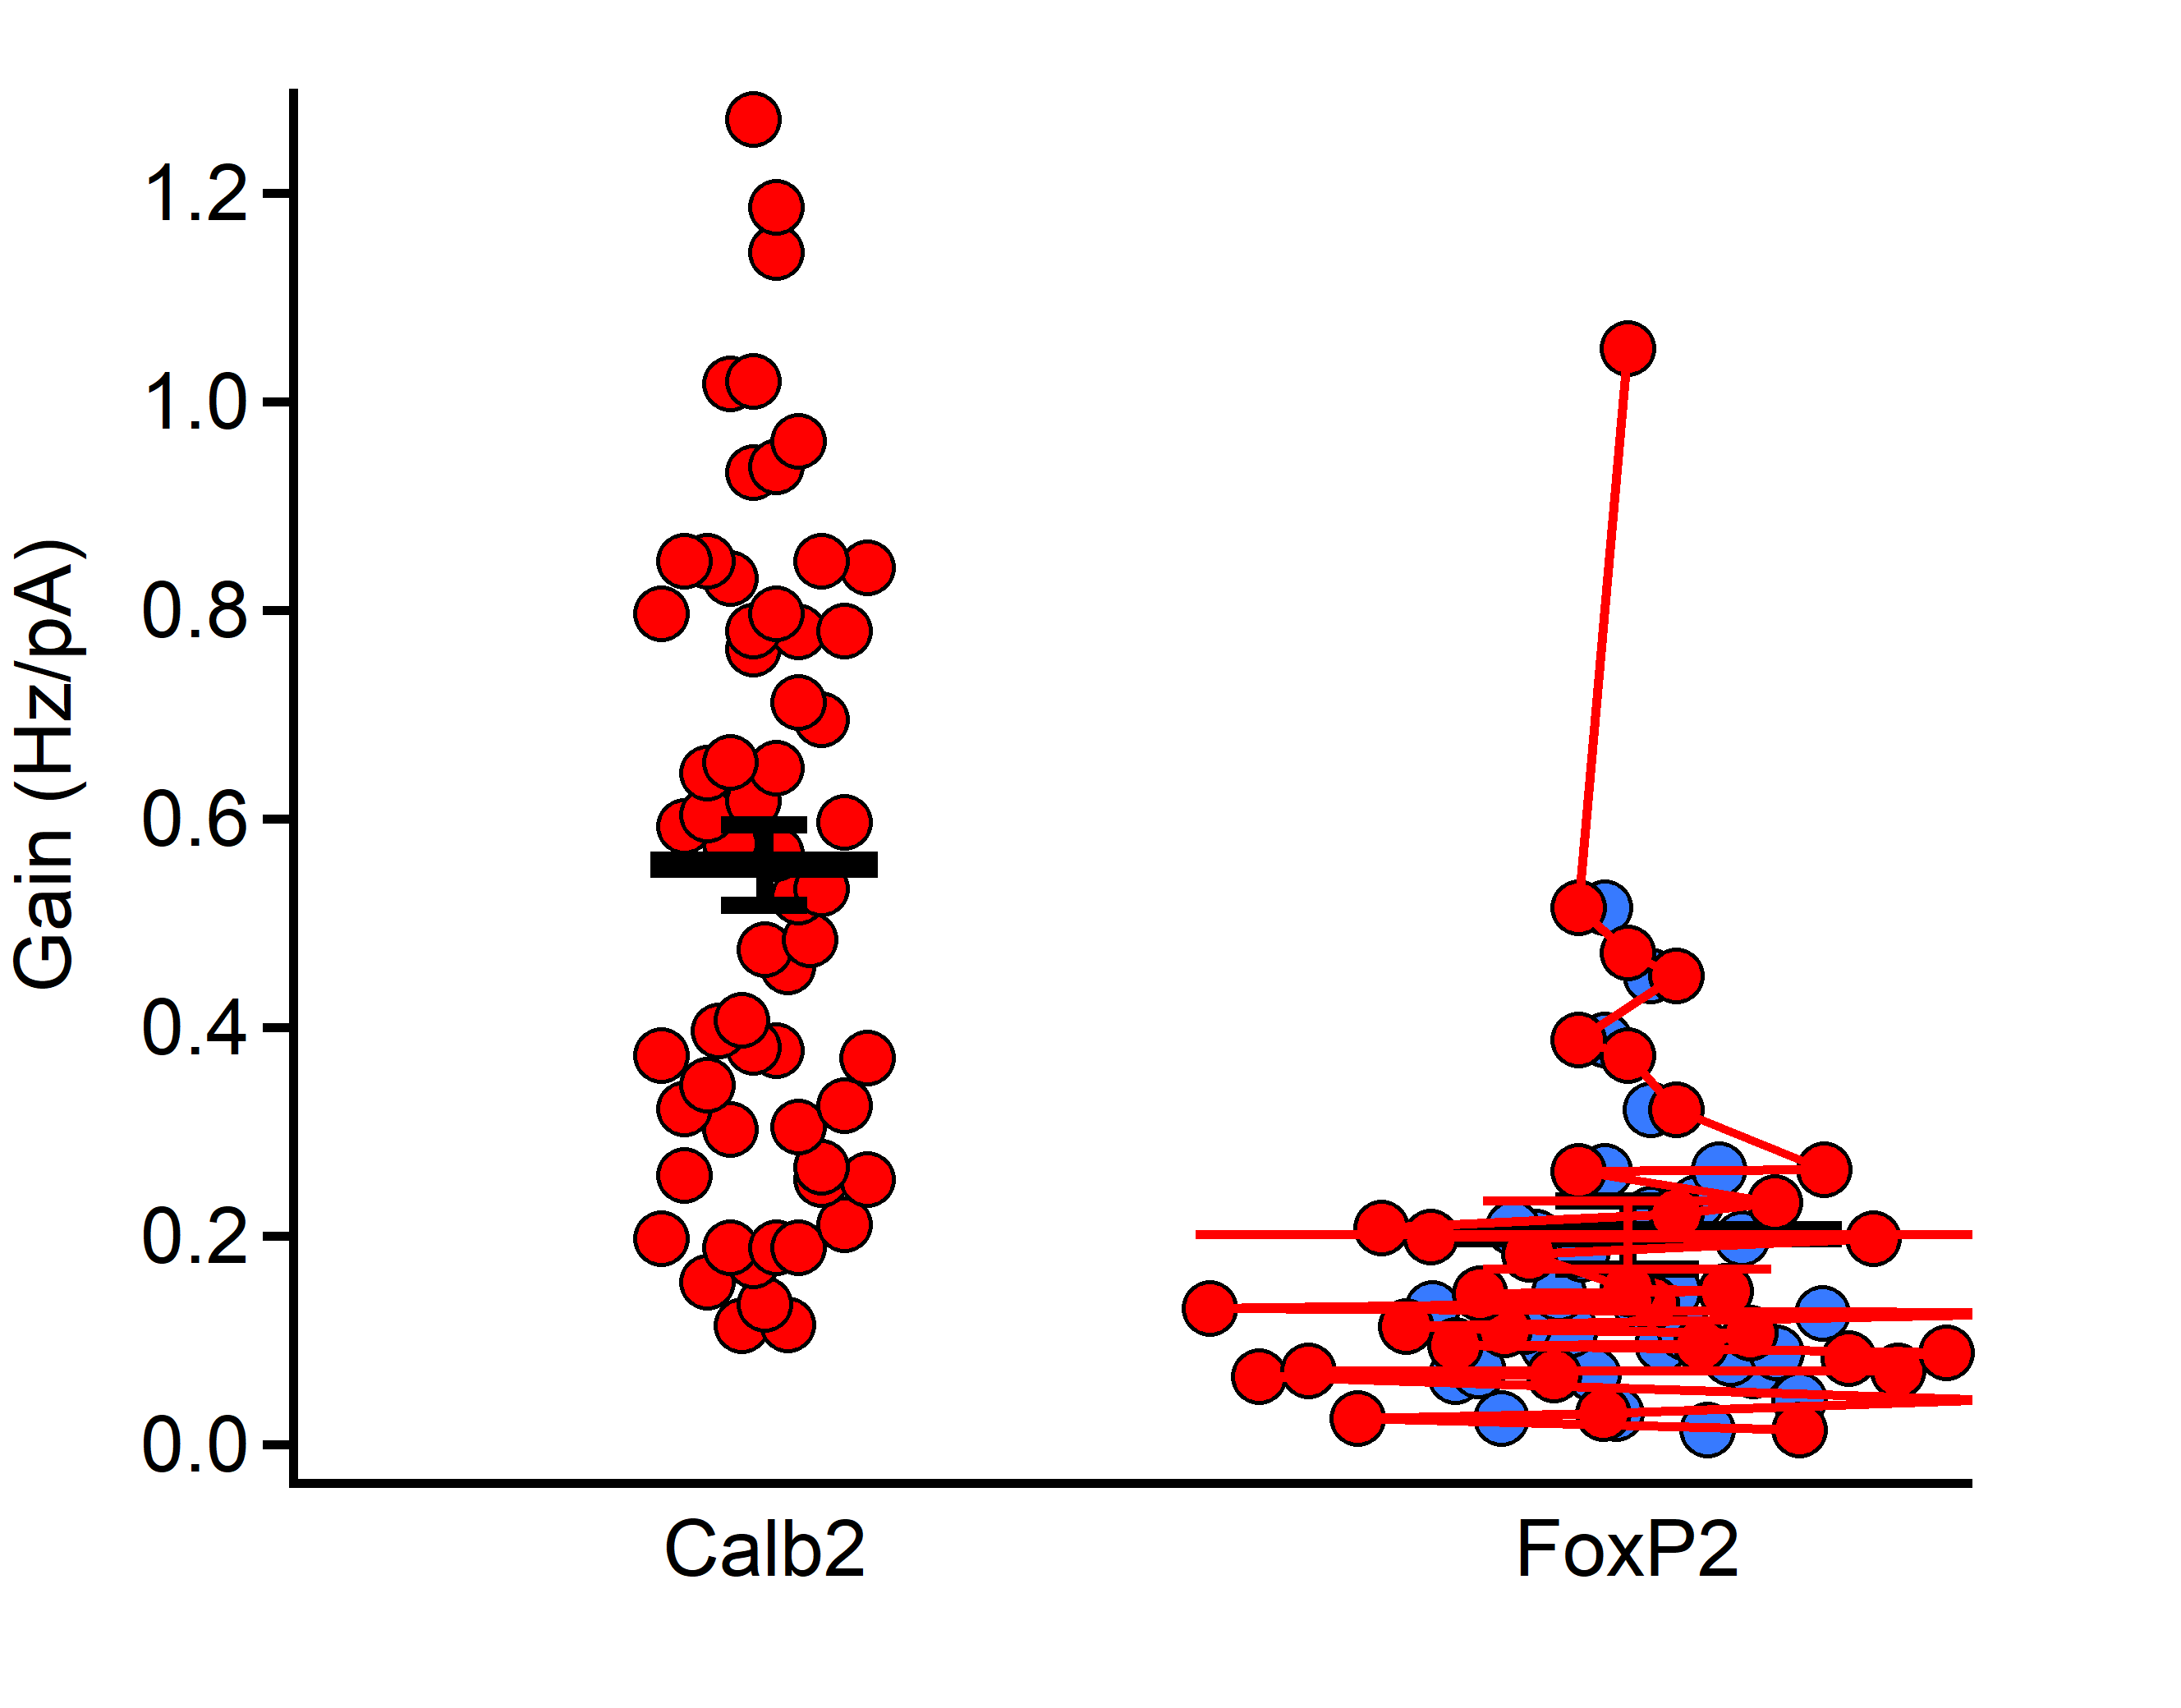
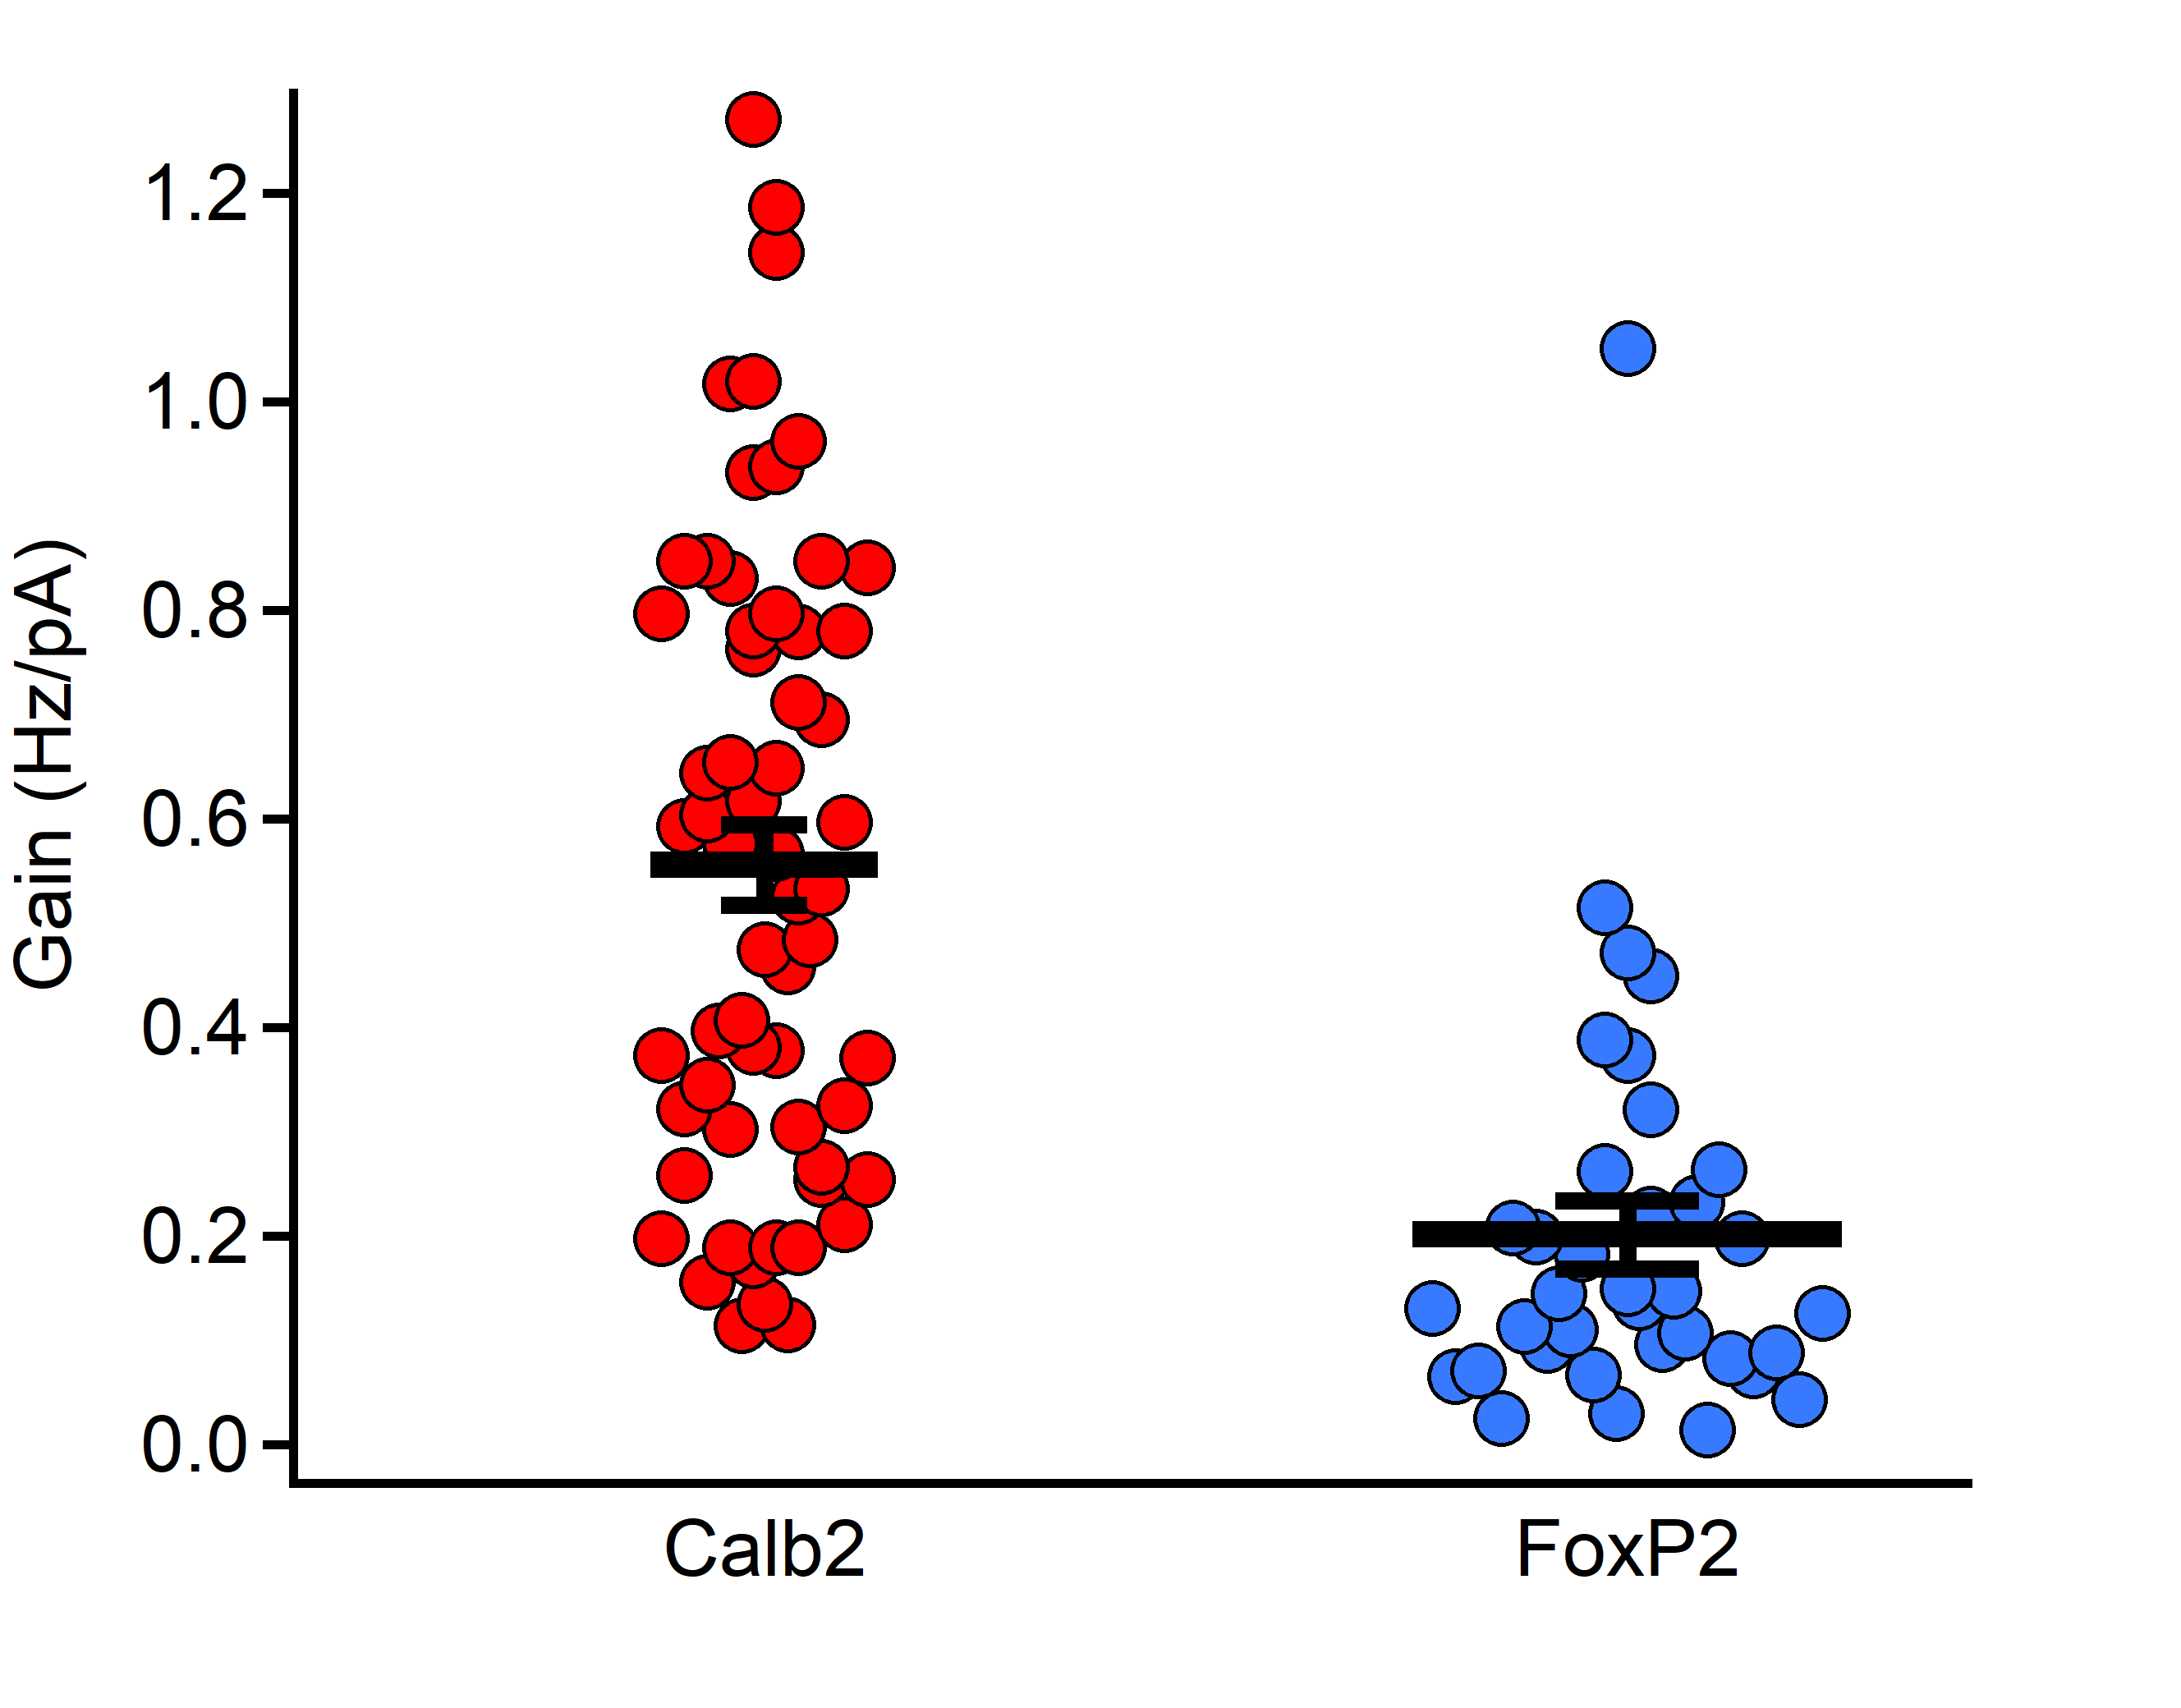
I am using Igor 7.08, and have discovered a strange behavior with the scatter dot plot graphs. When I have more than 1 dot plot graph in the experiment, each time I reopen the experiment, the data on the graph is duplicated (see attached example Graph 33). Any idea why? If I only have 1 dot plot graphed, this doesn't happen.
Welcome to the forum. Do you have a test experiment file which shows this behavior? But if it is a bug with Igor, then I guess the likely answer you will get is that Igor 7 is not supported anymore... this is ultimately something for the official staff to decide, of course.
May 28, 2024 at 06:58 am - Permalink
In Igor 9 you can do the same thing using the built-in Box Plot or Violin Plot features. Just make a box plot or violin plot, add the display of the actual data, then set line sizes for the boxes and violins to zero. Won't have that problem you show here. It is a paid upgrade.
May 28, 2024 at 05:25 pm - Permalink