Contour plot axis problem from a matrix data


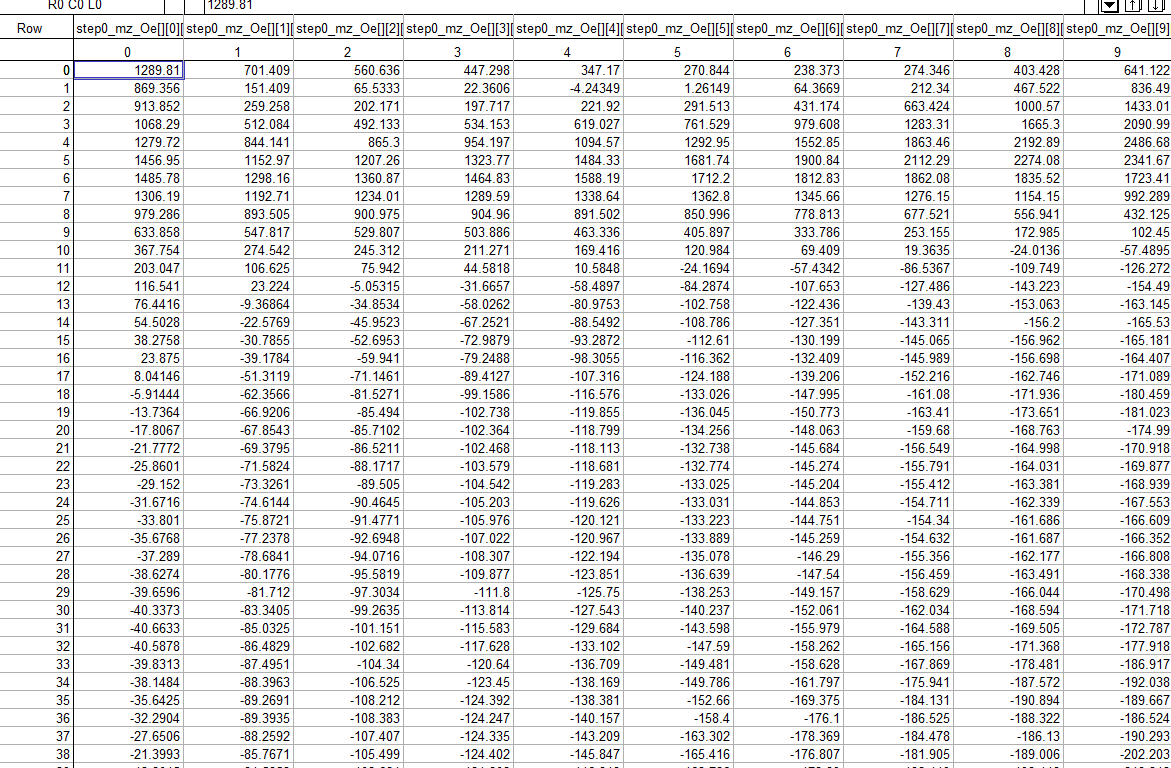
I have problem with swapping axes in contour plot. First I have one column data (57600). Then I changed this data to 60rows 120 col and 7 layers. Until here everything works fine.
However, when want to plot contour graph of this data looks like in the attachment. Top axis from 0 to 120 and left axis from 0 to 60.
I want to have bottom axis from 0 to 120 no top axis. I tried Transform Axis package but no luck.
ps. Later I also modify this bottom axis from 0 to 600 scale, How can I do that.
I attached also my data to show how it is look like.
thanks.

April 11, 2014 at 12:42 am - Permalink
Instead of NewImage step0_mz_Oe, try Display;AppendImage step0_mz_Oe. That will put the horizontal axis on the bottom, and will not reverse the left axis. If you really want the reversed X axis, double-click the left axis to bring up the Modify Axis dialog. Go to the Axis Range tab and click the Reverse Axis checkbox.
John Weeks
WaveMetrics, Inc.
support@wavemetrics.com
April 11, 2014 at 09:42 am - Permalink
It worked thank you very much:)
April 12, 2014 at 11:03 pm - Permalink