Category plot Y-axis keeps changing

Maarten1
Hope you can help me with this one.
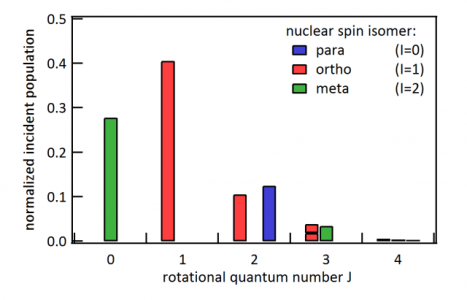
I use the category plots to plot several results that I obtain, and over all they really look nice. The only thing I find annoying is that the Y-axis somehow scales itself not to start from 0. An example is given in the picture. Somehow, the y-axis autoscales itself to -0.05, allowing the tickmark at 0 to be independently visible from the x-axis. Is there a way to leave the 0 for the y-axis really at the intercept with the x-axis? That would remove that ugly gap below the bars and remove the floating effect of all the bars.
Thanks all!


Is "standoff" enabled for the horizontal axis?
modifygraph standoff=0Is "Autoscale from zero" enabled for the vertical axis?
setaxis /E=1 left *,*Otherwise, could you please post the corresponding Igor experiment ("Save Graph Copy") to check the settings?
HJ
March 3, 2016 at 06:51 am - Permalink
axis standoff was indeed the culprit.
Regards,
Maarten
March 4, 2016 at 05:47 am - Permalink