Automatically findpeaks


Hello everyone!!
I really need your help.
Each experiment is stored in an individual folder, and each folder contain X and Y datas. I used those data to create a graph.
I have been able to obtain a great peak recognition using the Automatically Detect Peaks package, but this only allows me to identify peaks in one graph curve at a time.
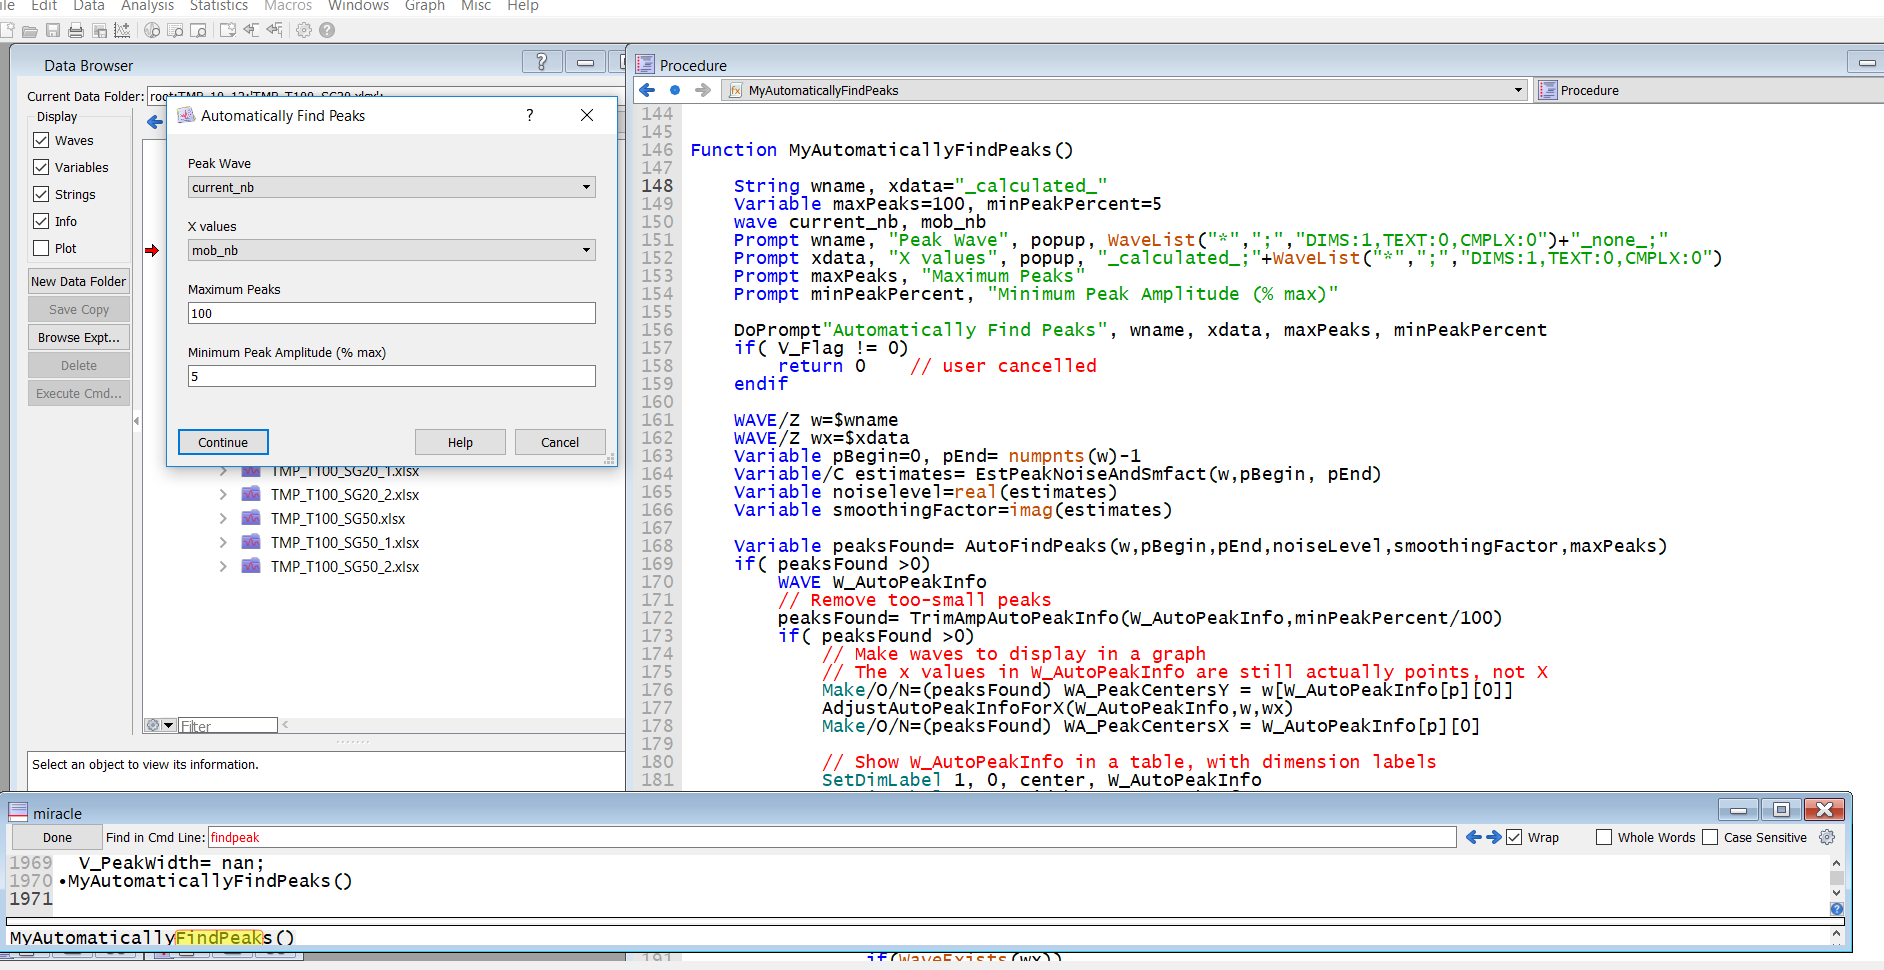
I would like to used this package Automatically find peaks. I found the code relative to it:
Function MyAutomaticallyFindPeaks()
	String wname, xdata="_calculated_"

	Variable maxPeaks=100, minPeakPercent=5
	wave current_nb, mob_nb
	Prompt wname, "Peak Wave", popup, WaveList("*",";","DIMS:1,TEXT:0,CMPLX:0")+"_none_;"
	Prompt xdata, "X values", popup, "_calculated_;"+WaveList("*",";","DIMS:1,TEXT:0,CMPLX:0")
	Prompt maxPeaks, "Maximum Peaks"
	Prompt minPeakPercent, "Minimum Peak Amplitude (% max)"

	DoPrompt"Automatically Find Peaks", wname, xdata, maxPeaks, minPeakPercent
	if( V_Flag != 0)
		return 0    // user cancelled
	endif

	WAVE/Z w=$wname
	WAVE/Z wx=$xdata

	Variable pBegin=0, pEnd= numpnts(w)-1
	Variable/C estimates= EstPeakNoiseAndSmfact(w,pBegin, pEnd)
	Variable noiselevel=real(estimates)
	Variable smoothingFactor=imag(estimates)

	Variable peaksFound= AutoFindPeaks(w,pBegin,pEnd,noiseLevel,smoothingFactor,maxPeaks)

	if( peaksFound >0)
		WAVE W_AutoPeakInfo

		// Remove too-small peaks
		peaksFound= TrimAmpAutoPeakInfo(W_AutoPeakInfo,minPeakPercent/100)
		if( peaksFound >0)
			// Make waves to display in a graph
			// The x values in W_AutoPeakInfo are still actually points, not X
			Make/O/N=(peaksFound) WA_PeakCentersY = w[W_AutoPeakInfo[p][0]]
			AdjustAutoPeakInfoForX(W_AutoPeakInfo,w,wx)
			Make/O/N=(peaksFound) WA_PeakCentersX = W_AutoPeakInfo[p][0]

			// Show W_AutoPeakInfo in a table, with dimension labels
			SetDimLabel 1, 0, center, W_AutoPeakInfo
			SetDimLabel 1, 1, width, W_AutoPeakInfo
			SetDimLabel 1, 2, height, W_AutoPeakInfo

			CheckDisplayed/A W_AutoPeakInfo
			if( V_Flag == 0)
				Edit W_AutoPeakInfo.ld
			endif

			DoWindow ShowPeaks
			if( V_Flag == 0)
				if(WaveExists(wx))
					Display/N=ShowPeaks w vs wx
				else
					Display/N=ShowPeaks w
				endif
				AppendToGraph/W=ShowPeaks WA_PeakCentersY vs WA_PeakCentersX
				ModifyGraph/W=ShowPeaks rgb(WA_PeakCentersY)=(0,0,65535)
				ModifyGraph/W=ShowPeaks mode(WA_PeakCentersY)=3
				ModifyGraph/W=ShowPeaks marker(WA_PeakCentersY)=19
			endif
		endif
	endif

	if( peaksFound <1)
		DoAlert 0, "No Peaks found!"
	endif

	return peaksFound
End
My problem is to know where in the code I can enter directly the name of the waves corresponding to the values X and Y, I don't want to have the prompt window to fill "peakwave", "Xvalues...".
Thanks you so much
By coincidence I just prepared a function for a customer that might provide a starting point for what you want to do. Here is the function:
The function is intended to take a list of waves, possibly XY pairs, and apply the Automatically Find Peaks functionality to it. The customer's request included being able to set the parameters of the peak finder as in Find Peaks Custom Parameters. If you are OK with the automatic parameters, you could remove the noiseLevel and smoothingFactor inputs and call something like this:
which is copied from the function AutomaticallyFindPeaks().
December 12, 2019 at 09:32 am - Permalink