analyzing a curve for X-width


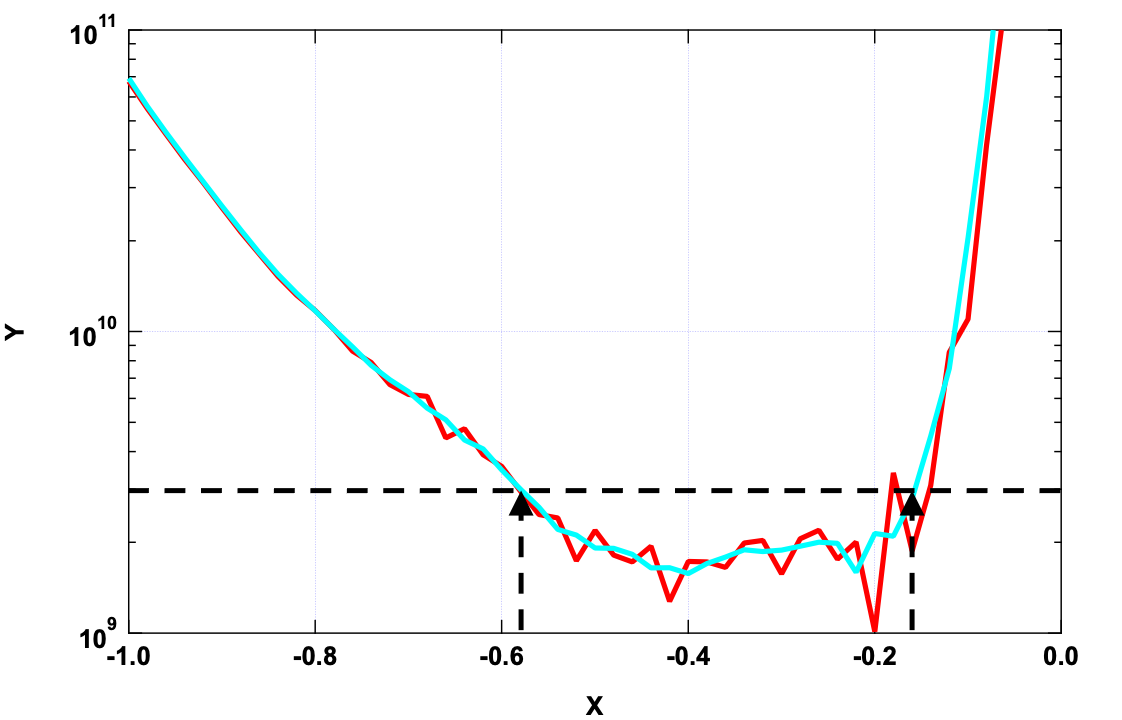
I need to analyze curves like the attached image. Specifically, I want to determine the spacing on the x-axis between the two vertical arrows, whose location is determined by where the curve exceeds a user-defined threshold. Think of the X-range as the range over which the performance of a system is acceptable.
The red curve is actual measured data, which has some apparent noise that has to be dealt with. The blue curve is a smoothed version of the measured data.
I have considered 2 approaches:
- work with the raw data (red curve) or a smoothed version (blue curve) and try to use some form of interpolation (Interpolate2 or implicit interpolation), but I don't know how to manipulate those interpolation functions to find 2 different points at which the function exceeds the threshold. I don't think these functions will easily find 2 different values of X to satisfy interpolation to the threshold value.
- fit a function to the data (there is a relevant theoretical formula, let's call it "Yfit") and then try to use FindRoots to find roots of (Yfit-Threshold). I have had mixed success in the past getting Findroots to find X-values at which a wave equals a certain value. Is there a better way of doing this?
I'm pretty sure I'm not the first person to try doing a simple operation like this. Any other suggestions out there?
Terry
I would simply do FindLevels on the smoothed data, then calculate the difference between the two found level crossings (x values). You could check whether exactly two or more/less x values have been found by the function to get some kind of error check in place (i.e., check whether the noise is not too high). Also, you could iterate your smoothing procedure, by successively increasing the smoothing factor, until exactly two crossing points are found.
June 15, 2024 at 09:25 pm - Permalink
The approach by @chozo is one method. For other methods, consider these steps where Z is the level and x is the smoothed data.
* calculate R = (x - Z)
* find the zero crossings (locations where the difference goes from positive to negative and back)
* calculate R2 = R^2
* differentiate R2
* find the zero crossings (locations where the slope abruptly changes signs)
June 16, 2024 at 02:27 pm - Permalink