3D density plots

Hans
I'm using Igor Pro 6 on Win8 64bit.
The other day, I wanted to plot intensity map of electric field (plane wave solution) in 3d using GIZMO and searched documents.
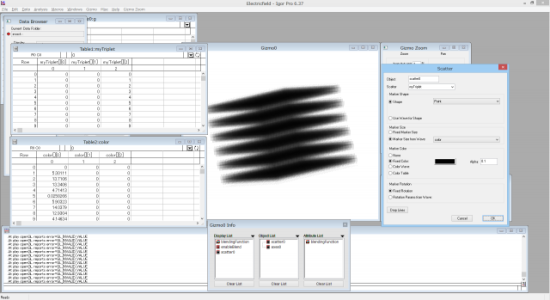
I prepared coordinates x,y,z (each has 30 points) and combined them into myTriplet.
I also prepared intensity and managed to plot like attached where intensity is represented as the largeness of the point (I also attached x,y,z,intensity file).
But in fact, I'd like to plot the intensity in color change, I mean, if intensity is high, color should be red, and otherwise in blue.
Is it possible to realize this in Igor Pro 6?
Thank you very much.
PS. I found WaveMetrics channel in youtube, and Introduction for GIZMO, but could not find the way to realize them.
Could I download the pxp file from anywhere? or find the introduction text?
Actually, I'd like to use this function!
https://youtu.be/I1HHHk6RZOk?t=2m18s


Since you apparently have created your Gizmo scatter plot, pay particular attention to the details of the necessary color wave:
"A scatter plot can be colored using a constant color, a color taken from one of the built-in color tables, or a custom color wave. A color wave must have 4 columns for RGBA entries in the range [0,1] with each row corresponding to a point in the scatter wave." (from the first help file)
Under ModifyGizmo , look for MakeTripletColorWave :
"makeTripletColorWave = {srcWave, ctabName, isInverse }
creates a 4 column color wave with a row entry corresponding to each row in srcWave. Each row contains RGBA color taken from built-in ctabName and scaled according to the size of the row's z-value. The alpha values is set to 1 except when the z-value is a NaN (in which case alpha is set to zero). Note that this keyword also works when srcWave is a 1D wave."
You should then be able to use the Gizmo Info GUI to apply this to your Scatter object, or else use ModifyGizmo (under Scatter) with
"Object Type propertyName propertyInfo
Scatter scatterColorType specifies the type of marker coloring.
0: constant marker color. Use color to specify the marker color.
1: marker color from user-specified wave. Use colorWave to specify the color wave."
February 3, 2016 at 06:51 am - Permalink
Thank you very much for your kind advice!
I figured out that color wave should be 4 columns with alpha value when I see the Help topic you pointed out.
Finally I successfully got a plot with color.
(I created xyzTriplet form x,y,z and then ModifyGizmo MakeTripletColorwave = {Intensity, RedWhiteBlue256, 1})
I appreciate your kind help!
February 3, 2016 at 08:21 pm - Permalink