Polar averaging and errors
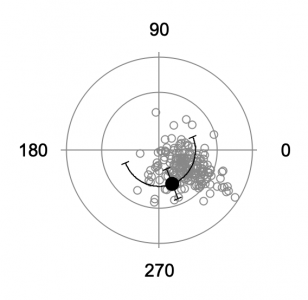
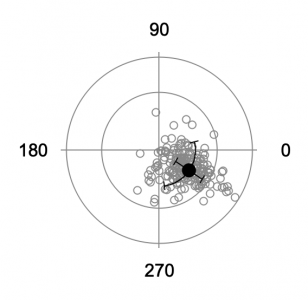
Averaging waves with polar data (list of angles) will give incorrect results in many cases (see image below). This function does a vector summation of X and Y components to determine the average angle, the standard deviation, or the standard error.
Function polarAvgErr(inWave,opStr,degrad)
    Wave inWave //single wave with list of angles

    //opStr = "avg", "sdev", or "sem"
    //degrad = "deg" or "rad" depending on the input data type
    String opStr,degrad
    Variable i,size,avgX,avgY,avg,sdev,sem,errX,errY,value,multiplier

    size = DimSize(inWave,0)
    Make/FREE/N=(size) xTotal,yTotal

    //input is degrees or radians
    strswitch(degrad)
        case "deg":
            xTotal = cos(inWave * pi/180)
            yTotal = sin(inWave * pi/180)
            multiplier = 180/pi
            break
        case "rad":
            xTotal = cos(inWave)
            yTotal = sin(inWave)
            multiplier = 1
            break
    endswitch

    //polar average
    avgX = mean(xTotal)
    avgY = mean(yTotal)
    avg = atan2(avgY,avgX)*multiplier

    If(avg < 0)
        avg += 360
    EndIf

    //polar standard deviation
    For(i=0;i<size;i+=1)
        errX += (xTotal[i] - avgX)^2/(size-1)
        errY += (yTotal[i] - avgY)^2/(size-1)
    EndFor

    errX = sqrt(errX)
    errY = sqrt(errY)
    sdev = atan2(errY,errX)*multiplier

    //polar standard error of the mean
    sem = sdev/sqrt(size)

    //select return parameter
    strswitch(opStr)
        case "avg":
            value = avg
            break
        case "sdev":
            value = sdev
            break
        case "sem":
            value = sem
            break
    endswitch

    return value
End


Forum

Support

Gallery
Igor Pro 10
Learn More
Igor XOP Toolkit
Learn More
Igor NIDAQ Tools MX
Learn More

You may want to look at StatsCircularMoments as it may save you some coding.
December 5, 2018 at 12:20 pm - Permalink
In reply to You may want to look at… by Igor
ahh, thank you - there's always a new function to discover...
December 5, 2018 at 12:24 pm - Permalink
I find the description and polar plots a little confusing. You imply that the only input is a 1-D wave of polar angles (or you use only the angular part of a {theta, r} wave), but the data set has multiple 'r' values. Are you selecting a constant-r set of values from your presented data?
Another approach for full 2-D (x,y) or (r,theta)-->(x,y) data might be to first perform a linear ODR fit to an (x,y) line constrained to pass through the origin to find the best-fit average angle. Then find the difference angle for each point to get the set of d_theta's for the standard deviation calculation. I note that StatsCircularMoments seems to apply only to 1-D data at a fixed radius.
December 6, 2018 at 08:25 am - Permalink