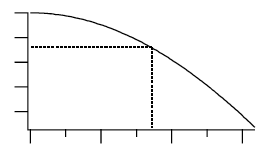
Level detection is the process of locating the X coordinate at which your data passes through or reaches a given Y value. This is sometimes called "inverse interpolation". Stated another way, level detection answers the question: "given a Y level, what is the corresponding X value?" Igor Pro® provides two kinds of answers to that question.
One answer assumes your Y data is a list of unique Y values that increases or decreases monotonically. In this case there is only one X value that corresponds to a Y value. Since search position and direction don´t matter, a binary search is most appropriate because it is quite fast. For this kind of data, use the BinarySearch or BinarySearchInterp functions.
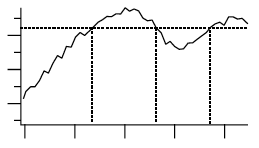
The other answer assumes that your Y data varies irregularly, as it would with acquired data. In this case, there may be multiple X values that cross the Y level; the X value returned depends on where the search starts and the search direction through the data. The FindLevel, FindLevels, EdgeStats, and PulseStats operations deal with this kind of data.
Finding a Level in Waveform Data
You can use the FindLevel operation to find a single level crossing, or the FindLevels operation to find multiple level crossings in waveform data. Both of these operations can optionally smooth the data they search to reduce the effects of noise. A subrange of the data can be searched, by either ascending or descending X values, depending on the startX and endX values you supply to the operation´s /R flag.
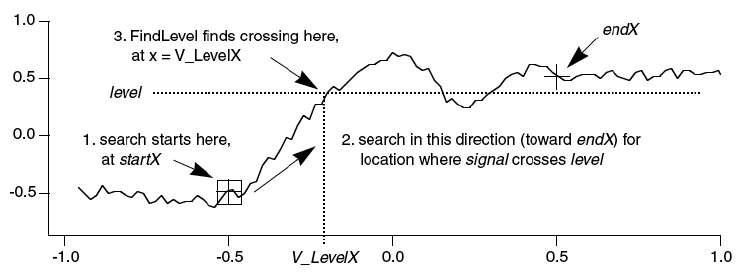
FindLevel locates the first level crossing encountered in the search range, starting at startX and proceeding toward endX until a level crossing is found. The search is performed sequentially. The outputs of FindLevel are two special numeric variables: V_Flag and V_LevelX. V_Flag indicates the success or failure of the search (0 is success), and V_LevelX contains the X coordinate of the level crossing.
For example, given the following data:
the command:
FindLevel/R=(-0.5,0.5) signal,0.36
prints this level crossing information into Igor´s history area:
V_Flag= 0; V_LevelX= -0.200751;
Finding a Level in XY Data
You can find a level crossing in XY data by searching the Y data and then figuring out where in the X data that X value can be found. This requires that the X data values be sorted in ascending or descending order. To ensure this, the command:
Sort xData,xData,yData
sorts the data so that the values in xData are ascending, and the XY correspondence is preserved.
Then find V_levelX in yData:
FindLevel yData, levelToFind
Then all that's needed is a little interpolation using the point-slope equation:
 // Compute point number (not X) in yData before Y crossing.
Variable p1=x2pnt(yData,V_LevelX-deltaX(yData)/2)

// Compute slope of line between the two X,Y points before and after the yData level crossing.
Variable m=(V_LevelX-pnt2x(yData,p1))/(pnt2x(yData,p1+1)-pnt2x(yData,p1))

// Use the point-slope equation of a line to interpolate the xData value at the level crossing.
Variable xAtYlevel= xData[p1] + m * (xData[p1+1] -xData[p1] ) //point-slope equation
Edge Statistics
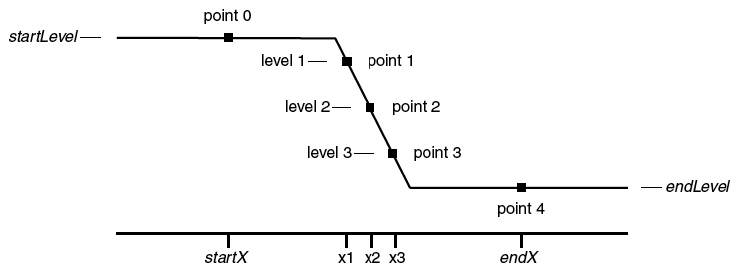
The EdgeStats operation produces simple statistics (measurements, really) on a region of data that is expected to contain a single edge as shown below. If more than one edge exists, EdgeStats works on the first edge it finds. The edge statistics are stored in special variables which are described in the EdgeStats reference. The statistics are edge levels, X or point positions of various found "points", and the distances between them. These found points are actually the locations of level crossings, and are usually located between actual waveform points (they are interpolation locations).
EdgeStats is based on the same principles as FindLevel. EdgeStats does not work on an XY pair. You can convert XY Data to a waveform using interpolation.
Pulse Statistics
The PulseStats operation produces simple statistics (measurements) on a region of data that is expected to contain three edges as shown below. If more than three edges exist, PulseStats works on the first three edges it finds. PulseStats handles two other cases in which there are only one or two edges. The pulse statistics are stored in special variables which are described in the PulseStats reference.
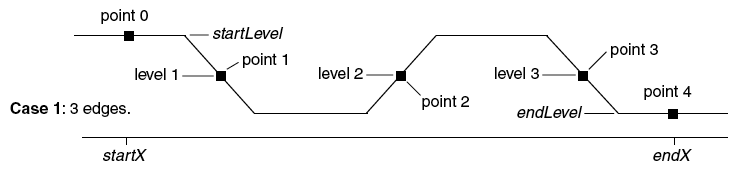
PulseStats is based on the same principles as EdgeStats. PulseStats does not work on an XY pair.

Forum

Support

Gallery
Igor Pro 10
Learn More
Igor XOP Toolkit
Learn More
Igor NIDAQ Tools MX
Learn More