Signal Processing is the art and science of modifying acquired time-series data for the purposes of analysis or enhancement. Examples include spectral analysis (using the Fast Fourier or other transforms) and enhancing acquired data using digital filtering.
Igor Pro® is ideally suited for signal processing because of its strong support for lengthy time-series (or "waveform") data, and because its many built-in signal processing commands can easily be used through simple dialogs.
In addition, Igor´s programming language makes it straightforward to implement any kind of custom signal processing algorithm, greatly aided by the power of Igor´s Fourier (and other) Transforms.
Fourier Transforms
Igor uses the Fast Fourier Transform (FFT) algorithm to compute a Discrete Fourier Transform (DFT). The FFT can be used to simply characterize the magnitude and phase of a signal, or it can be used in combination with other operations to perform more involved computations such as convolution or correlation.
Spectral Windowing
The FFT computation presumes that the input data repeats over and over. This is important when the initial and final values of your data are not the same: the discontinuity causes aberrations in the spectrum computed by the FFT. "Windowing" smooths the ends of the data to eliminate these aberrations.
Power Spectra
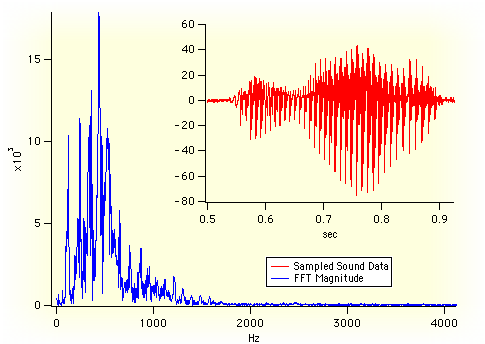
"Power Spectra" answer the question "which frequencies contain the signal´s power?" The answer is in the form of a distribution of power values as a function of frequency, where "power" is considered to be the average of the signal². In the frequency domain, this is the square of FFT´s magnitude.
Power spectra can be computed for the entire signal at once (a "periodogram") or periodograms of segments of the time signal can be averaged together to form the "power spectral density".
Hilbert Transform
The Hilbert Transform computes a time-domain signal that is 90 degrees "out of phase" with the input signal. One-dimensional applications include computing the envelope of a modulated signal and the measurement of the decay rate of an exponentially decaying sinusoid often encountered in underdamped linear and non-linear systems.
Time Frequency Analysis
When you compute the Fourier spectrum (or Power Spectra) of a signal you dispose of all the phase information contained in the Fourier transform. You can find out which frequencies a signal contains but you do not know when these frequencies appear in the signal. For example, consider the signal:
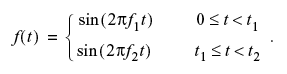
The spectral representation of f(t) remains essentially unchanged if we interchange the two frequencies f1 and f2:
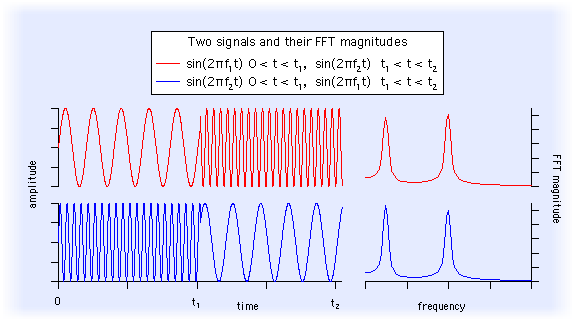
Clearly the Fourier spectrum is not the best analysis tool for signals whose spectra fluctuate in time.
One solution to this problem is the so-called "Short-time Fourier Transform" (or "Sonogram") in which you can compute the Fourier spectra using a sliding temporal window. By adjusting the width of the window you can determine the time resolution of the resulting spectra.
Other alternative tools are the Wigner transform, the Continuous Wavelet Transform (CWT), and the Discrete Wavelet Transform (DWT).
Convolution and Correlation
You can use convolution to compute the response of a linear system to an input signal. The linear system is defined by its impulse response. The convolution of the input signal and the impulse response is the output signal response. Digital filtering is accomplished by defining a linear system´s impulse response that when convolved with the signal accomplishes the desired result (low-pass or high-pass filter).
The correlation algorithm is very similar mathematically to convolution, but is used for different purposes. It is most frequently used to identify the time delay at which two signals "line up", or are "most similar".
Smoothing
Smoothing removes short-term variations, or "noise" to reveal the important underlying form of the data.
The simplest form of smoothing is the "moving average" which simply replaces each data value with the average of neighboring values. (Other terms for this kind of smoothing are "sliding average", "box smoothing", or "boxcar smoothing".)
Igor´s Smooth operation performs box smoothing, "binomial" (Gaussian) smoothing, and Savitzky-Golay (polynomial) smoothing. The different smoothing algorithms compute weighted averages that multiply neighboring values by differing weights or "coefficients" to compute the smoothed value.
Digital Filters
Digital filters are a natural tool when data is already digitized. Reasons for applying digital filtering to data include:
- Elimination of unwanted signal components ("noise")
- Enhancing of desired signal components
- Detecting the presence of certain signals
- Simulation of linear systems (compute the output signal given the input signal and the system´s "transfer function")
Digital filters generally come in two flavors: Finite Impulse Response (FIR) and Infinite Impulse Response (IIR) filters.
Igor implements digital filtering primarily through time-domain convolution using the FilterFIR, FilterIIR, and Smooth commands.
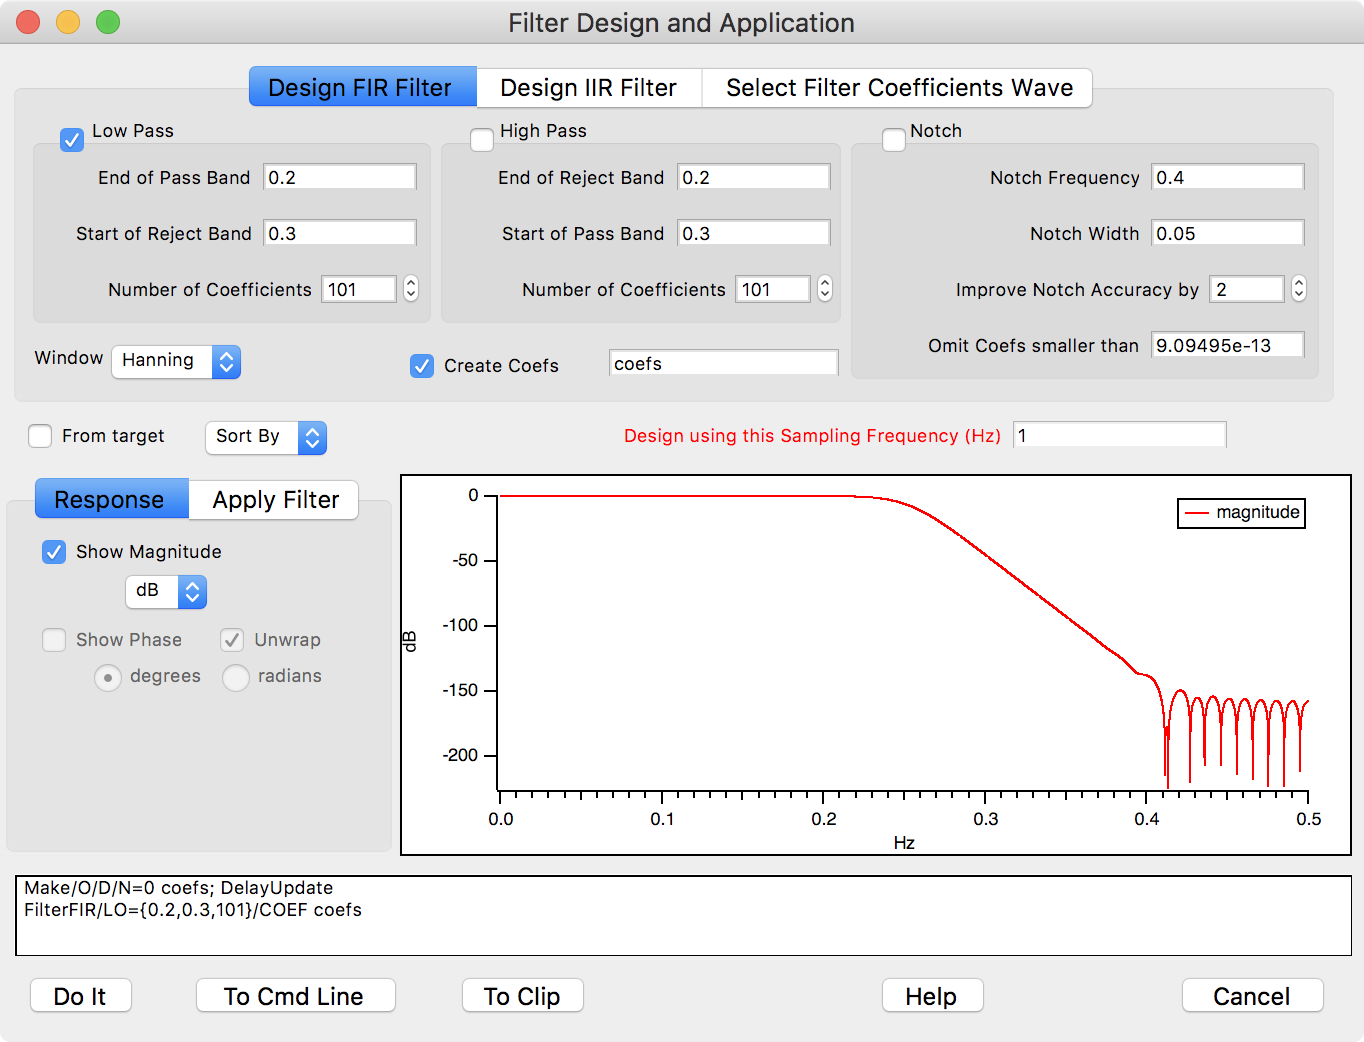
Igor 6 and later have an Analysis→Filter menu item which opens a Filter Design and Application dialog:
Another method for designing FIR and IIR filters is the Igor Filter Design Laboratory.
Level Detection
Level detection is the process of locating the X coordinate at which your data passes through or reaches a given Y value. This is sometimes called "inverse interpolation". Stated another way, level detection answers the question: "given a Y level, what is the corresponding X value?"
Igor provides two kinds of answers to that question. One answer assumes your Y data is a list of unique Y values that increases or decreases monotonically.
The other answer assumes that your Y data varies irregularly, as it would with acquired data. In this case, there may be multiple X values that cross the Y level. Important examples of this are edge and pulse statistics.
A related, but different question is "given a function y = f(x), find x where y is zero (or some other value)". This question is answered by the FindRoots operation.
To detect peaks; see Peak Analysis.
Igor´s Signal Processing Commands
| area | areaXY | BinarySearch |
| BinarySearchInterp | Convolve | Correlate |
| CWT | Differentiate | DSPDetrend |
| DSPPeriodogram | DWT | EdgeStats |
| faverage | faverageXY | FFT |
| FindLevel | FindLevels | Hanning |
| HilbertTransform | IFFT | ImageWindow |
| Integrate | Interp2D | Interp3d |
| interp | PCA | PulseStats |
| Rotate | Smooth | SmoothCustom |
| Unwrap | WignerTransform |

Forum

Support

Gallery
Igor Pro 10
Learn More
Igor XOP Toolkit
Learn More
Igor NIDAQ Tools MX
Learn More