New graph details
Create an XY graph in Igor by first visiting the New Graph dialog and selecting your data from x and y lists.
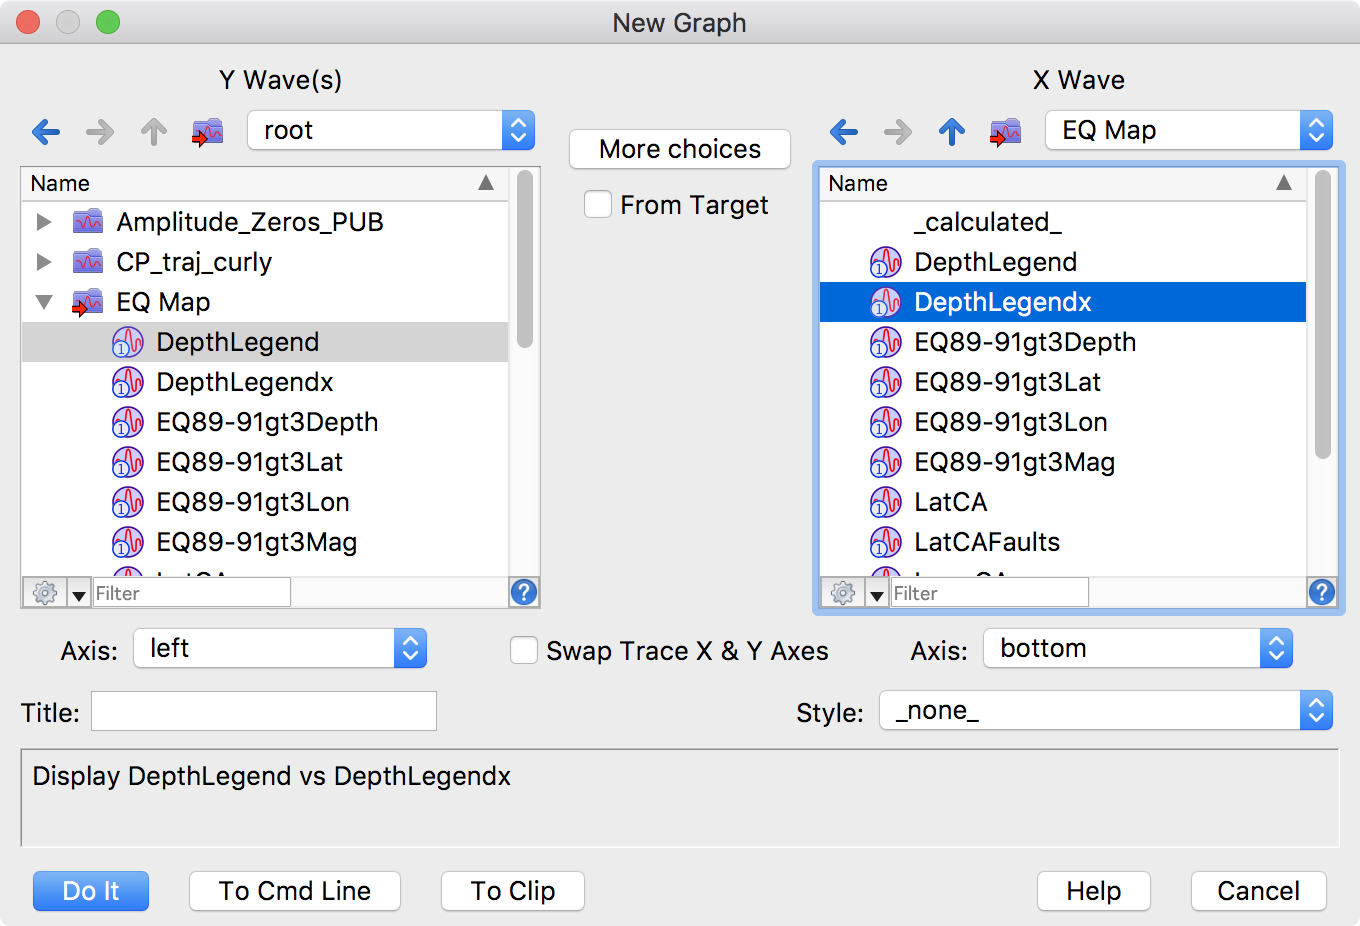
The lists in this dialog, as well as those in other dialogs, can be configured to a simple mode that shows only the data in the current data folder or a more complex mode that give you access to all the data in the workspace. The example shows the more complex form.
Similarly, the dialog can switch between a simple layout for the most common graphs and a more complex mode suitable for graphs with multiple axes or multiple xy pairs. Individual xy pairs can be designated to plot either horizontally or vertically and you can specify a subrange of data, such as individual rows or columns from a matrix.
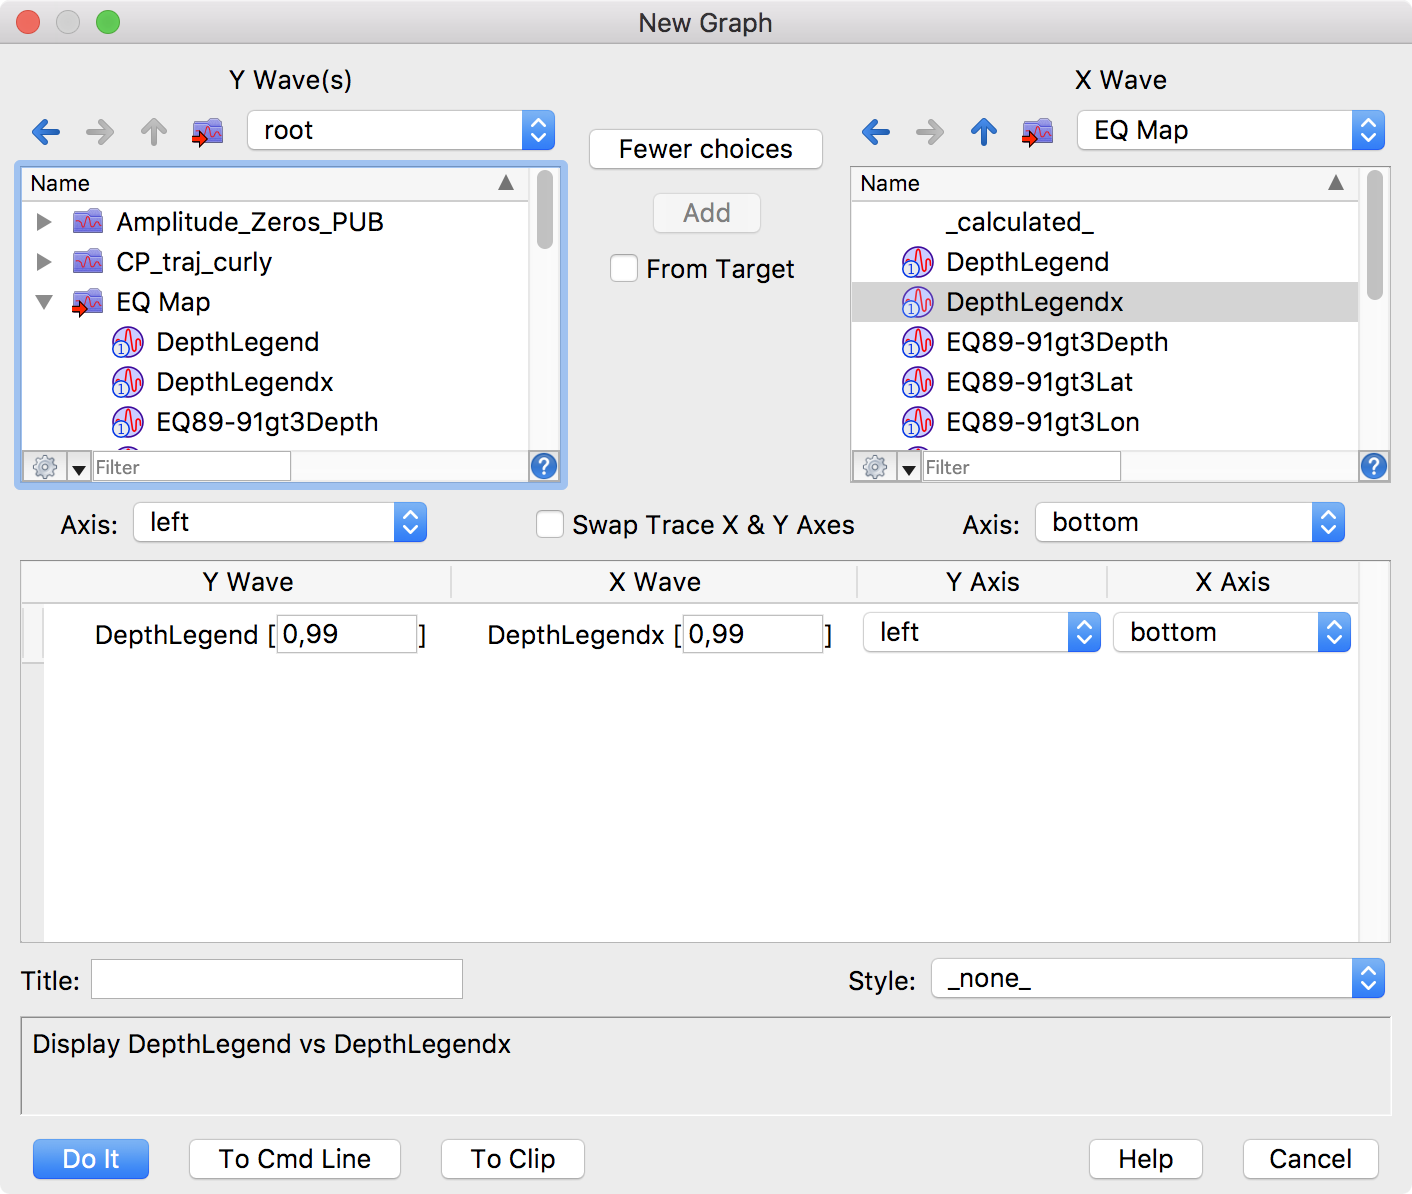
Although the New Graph dialog lets you create a complex graph in a single step, you can easily start with a simple graph and add data and axes later.
While selecting your data using either form of the dialog, you can choose a graph template you may have created in past sessions. The style of the initial graph is also affected by preferences you may have previously set.

Forum

Support

Gallery
Igor Pro 10
Learn More
Igor XOP Toolkit
Learn More
Igor NIDAQ Tools MX
Learn More